Process Mapping: How to Map a Process Step by Step
A process you cannot see is a process you cannot improve. Mapping is the quickest way to see it, and the maps you draw are also the cheapest analysis tool you have.
Process mapping is drawing a process as a diagram so everyone can see the steps, decisions and owners. To map one: define its start and end, list the real steps with the people who do them, draw them in order with decision points, add owners as swimlanes, then look for delays, handoffs and rework. On the CoMng.AI whiteboard you can then convert the map into tasks.
- Pick a map type: flowchart for steps, swimlane for owners, SIPOC for scope.
- Map what really happens: interview the people who do the work, not just the manual.
- Look for friction: waits, handoffs, loops, unclear owners and missing decisions.
- Make it actionable: turn the improved map into tasks and keep it as the reference.
Choose a Map Type
| Map | Shows | Use when |
|---|---|---|
| Flowchart | Steps and decisions in order | Understanding one flow |
| Swimlane | Steps grouped by owner or team | Handoffs and responsibility matter |
| SIPOC | Suppliers, Inputs, Process, Outputs, Customers at high level | Scoping a process before detail |
| Value stream map | Value-adding time vs waiting time | Hunting for waste |
Map a Process in Seven Steps
1. Define start and end
Name the trigger and the finished result.
2. List the actual steps
Talk to the people who do the work; the real process differs from the documented one.
3. Order them
Draw the flow left to right.
4. Mark decisions
Show each branch and its rule.
5. Add owners
Use swimlanes so every step has a person or role.
6. Add measures
Note time taken and waiting time per step.
7. Find friction
Look for waits, handoffs, loops, rework and unowned steps.
Mapping on the CoMng.AI Whiteboard
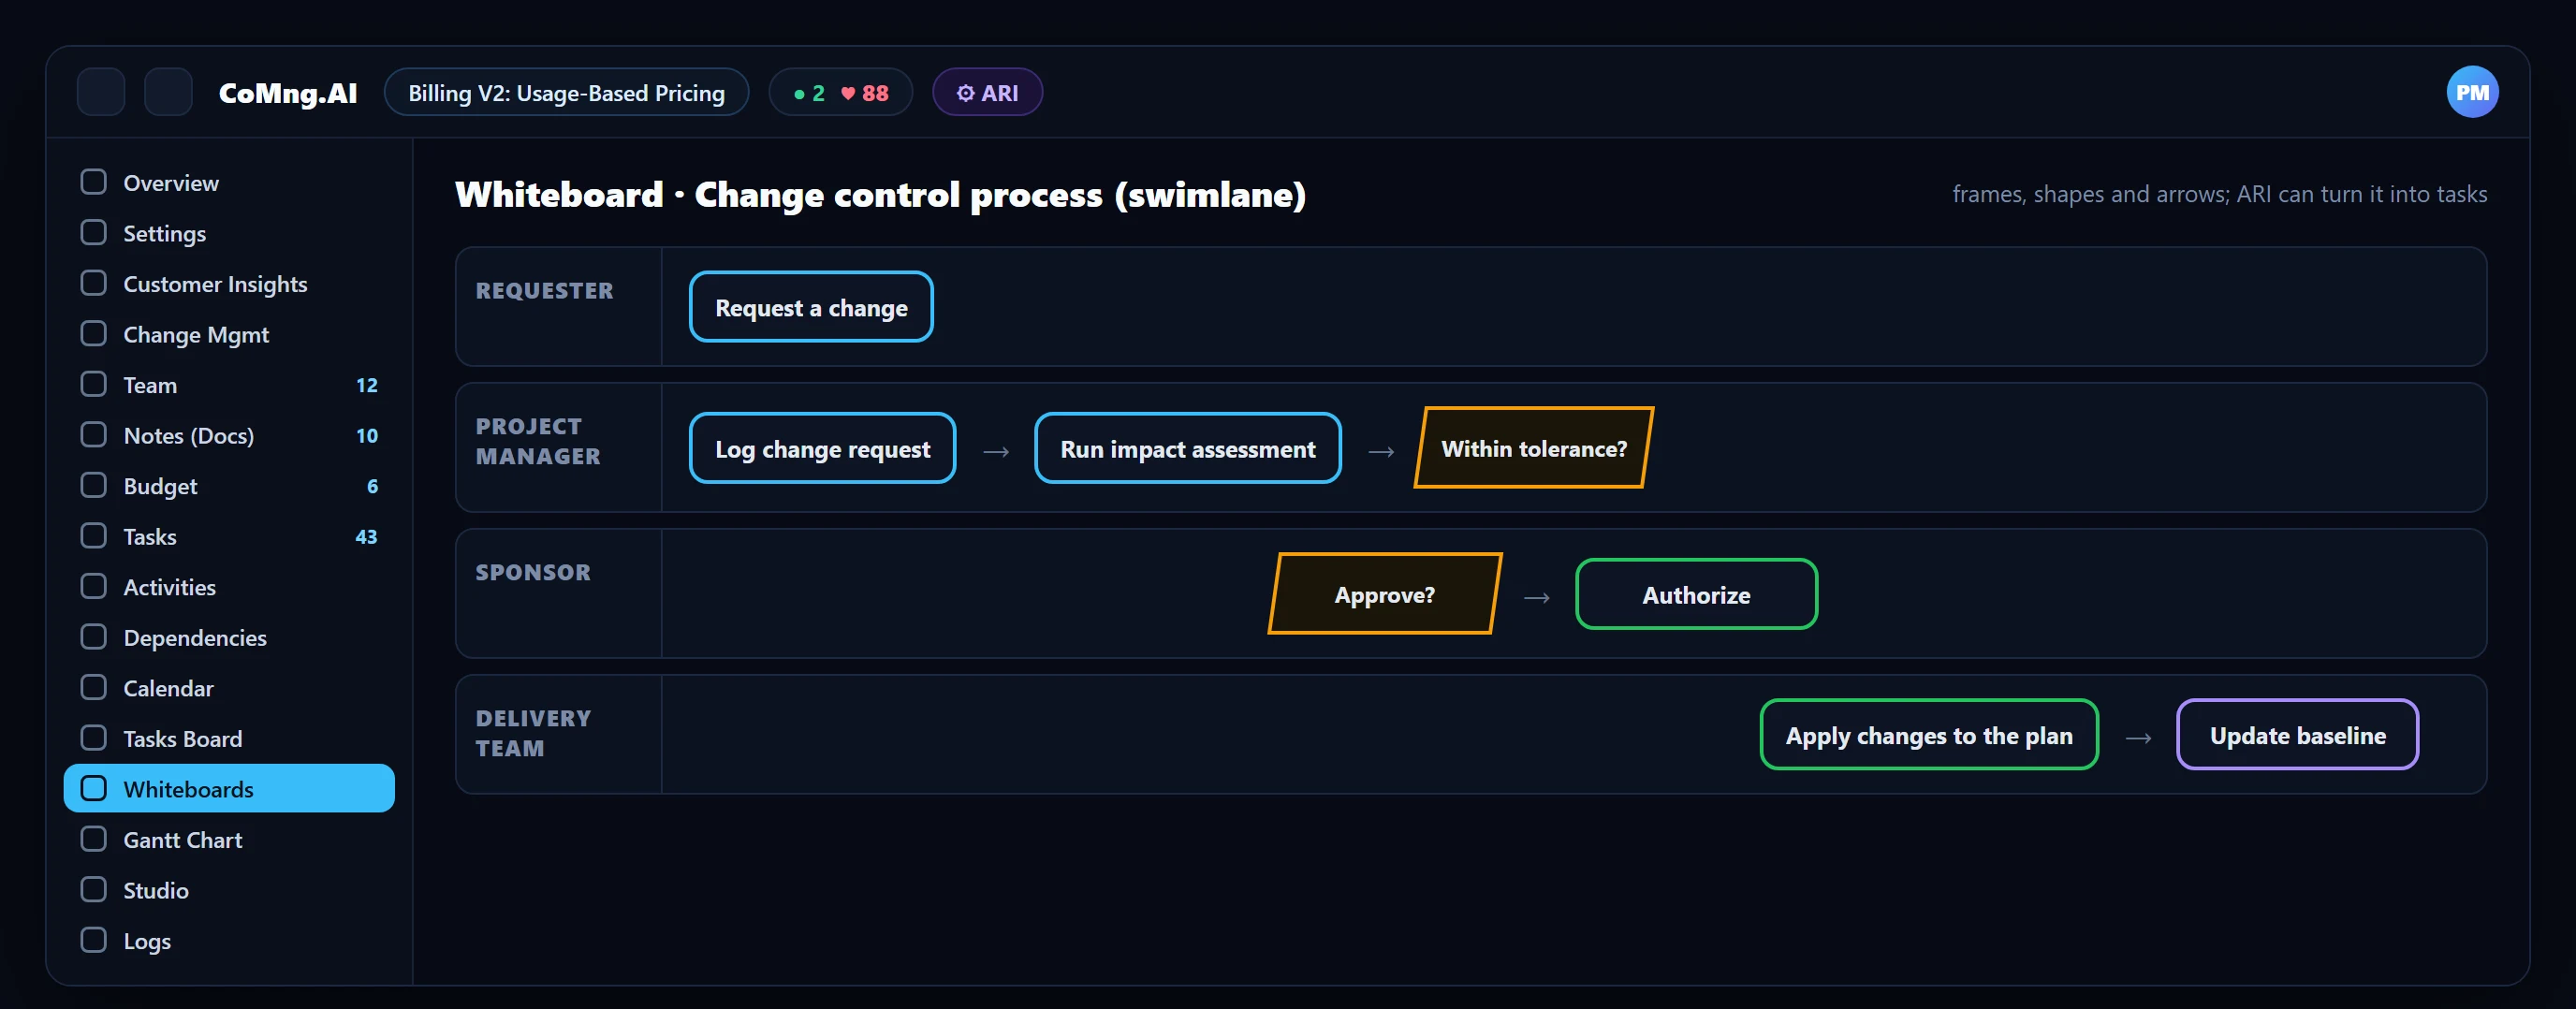
The CoMng.AI whiteboard has frames, shapes (rectangles, diamonds), arrows, sticky notes, images and templates, with comments and votes, and a PNG export. That is enough to draw a swimlane: use frames or a rectangle per lane, boxes for steps and diamonds for decisions. When the map is agreed, ask ARI to create tasks from it so the improvements become work in the plan.
Reading the Map for Improvement
- Long waits between steps usually mean a missing owner or a queue.
- Many handoffs invite delay and error.
- Loops show rework; ask why.
- Decisions with no rule create inconsistency.
- Steps nobody owns are where processes break.
Pair mapping with a methodology and adherence measures.
- The process exists only in people's heads
- Delay blamed on individuals
- Improvements argued from opinion
- A shared map everyone can see
- Delay traced to a step or handoff
- Improvements converted into tasks
About CoMng.AI
CoMng.AI is an AI-native project management platform that generates a project's plan, tasks, risks and budget from a description or document, monitors project health in real time, and gives both human teams and AI coding agents live access to the same project data, with a person approving every AI-generated change.
Make your project delivery process visible and measurable
Start free, map your change and approval flow, and let Pulse, change requests and audit logs show how it really runs.
Frequently Asked Questions
What is process mapping?
Drawing a process as a diagram that shows its steps, decisions and owners so it can be understood and improved.
What is a swimlane diagram?
A process map with lanes for each owner or team, showing who does each step and where handoffs occur.
How do I map a process?
Define its start and end, list the real steps with the people who do them, order them, mark decisions, add owners and measures, then look for friction.
Can I map a process on the CoMng.AI whiteboard?
Yes, using frames, shapes, arrows and notes, and ARI can then create tasks from the board.
What is SIPOC?
A high-level map of Suppliers, Inputs, Process, Outputs and Customers used to scope a process before mapping detail.
Related reading
See the full guide: Business Process & Process Management Guide