Watermelon Project: Why Status Reports Hide Risk
A watermelon project looks green outside and red inside. See how a live health score and worst-of-five RAG status expose hidden trouble.
- The Watermelon Illusion: A watermelon project reports green while underlying metrics are dangerously red, hidden by manual status typing and averaged summaries.
- The Fallacy of Averaging: Four green dimensions combined with one critical red dimension produce a deceptive 'Green' or 'Amber' overall score.
- Worst-of-Five Rule: CoMng.AI scores Schedule, Milestones, Risks, Issues, and Budget—if any dimension is Red, the overall project status is Red.
- Live Calculated Telemetry: The 0–100 Pulse score is read-only and mathematically calculated from real project data, eliminating subjective optimism.
The Deceptive Friday Status Deck
The deck said green for eight weeks. The budget was red for six of them.
Every executive sponsor has experienced this betrayal: a project that is reported as 'Green' week after week suddenly crashes three weeks before launch. The failure did not happen overnight; it was concealed beneath manual status slides and averaged performance metrics.
What is a watermelon project?
A watermelon project is one that looks green in status reports but is red underneath. It happens when status is self-reported, softened or averaged across dimensions, so a serious problem in one area, such as budget or milestones, disappears from the summary.
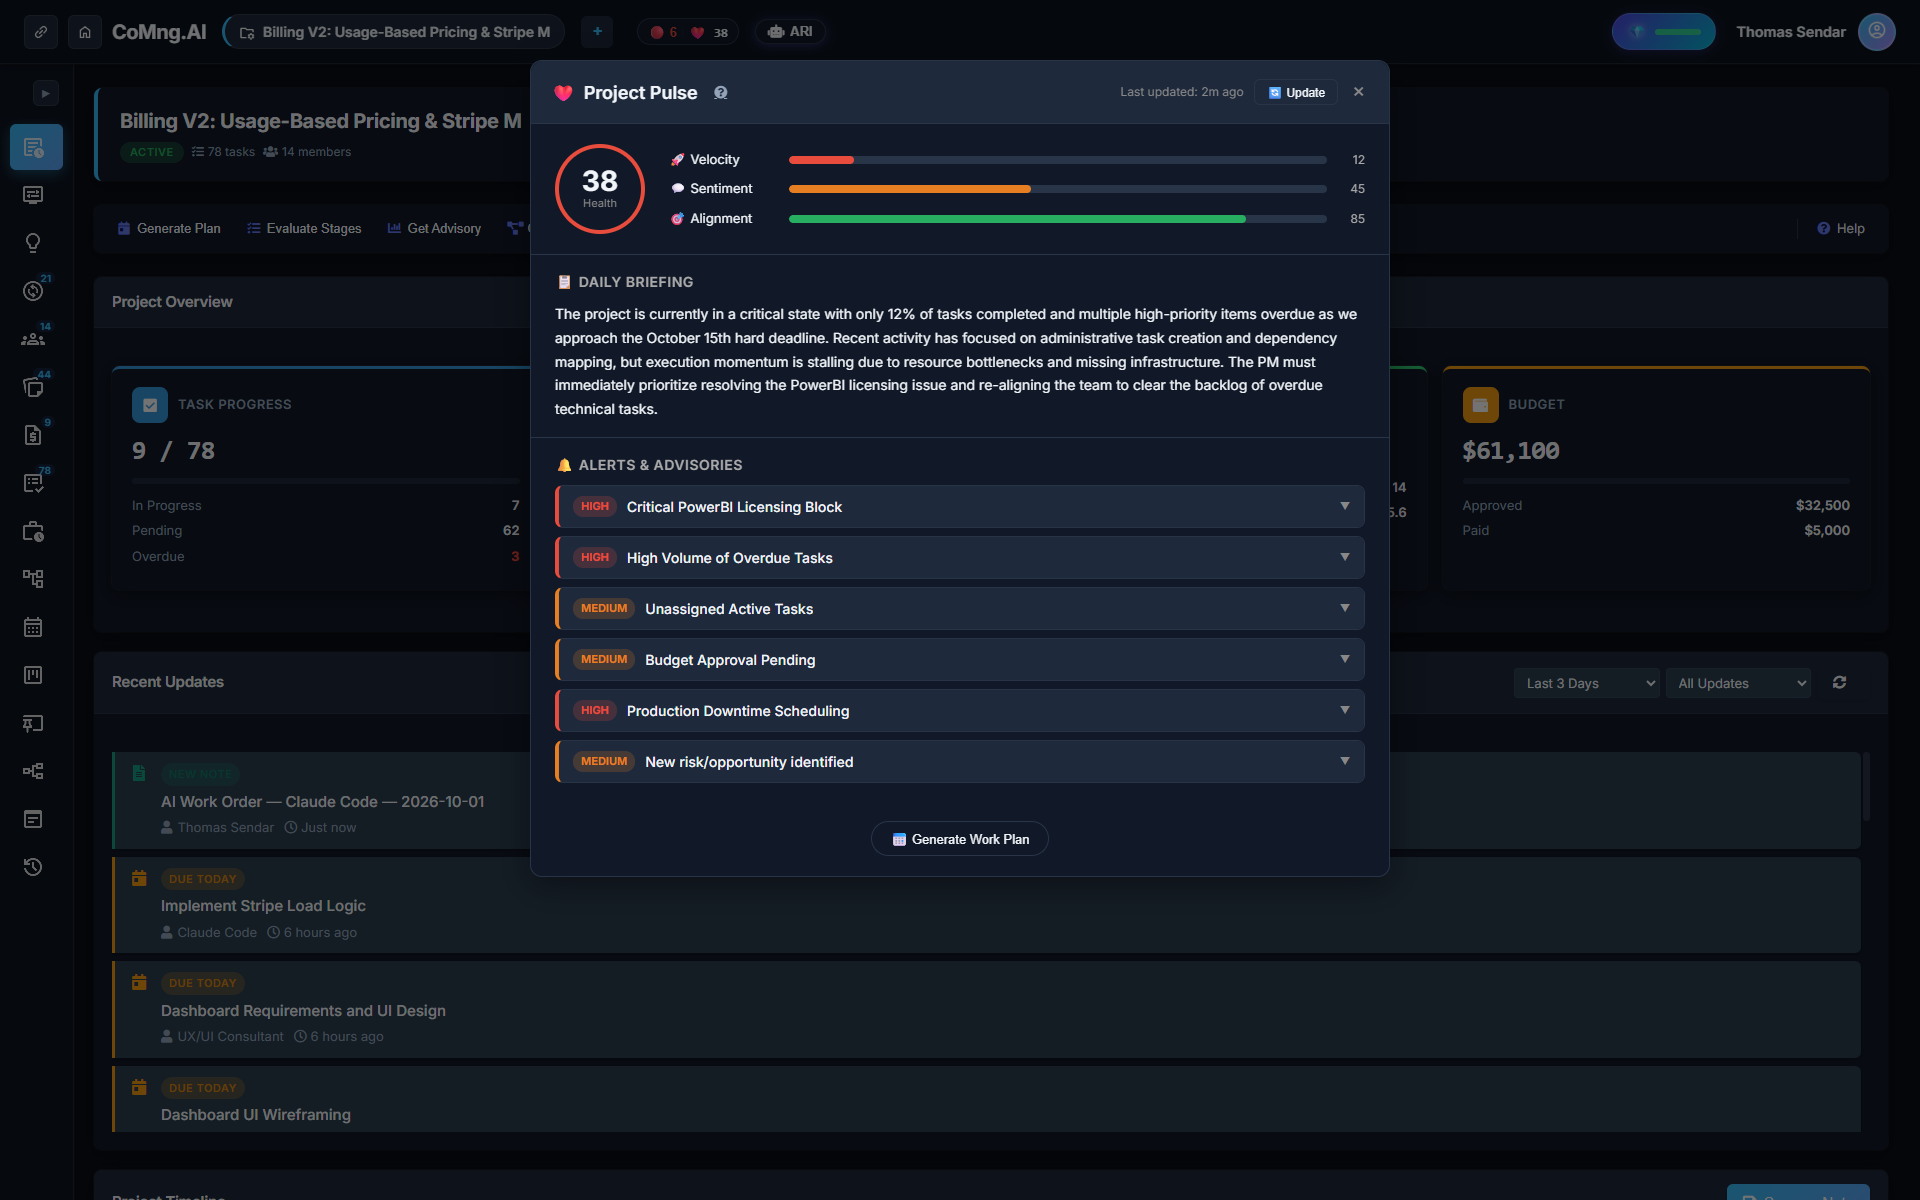
Why Averaged Status Hides Critical Trouble
Consider a standard project report with five evaluated dimensions:
- Schedule: 95% (Green) - Milestones: 90% (Green) - Team Morale: 85% (Green) - Scope: 90% (Green) - Budget: 35% Spent over contract cap (Critical Red)
In conventional tools, the average score is 79% (Green or light Amber). In reality, the project is bankrupt. Averaging creates a false sense of security while critical risks fester.
The Worst-of-Five Governance Rule
| RAG Dimension | Green Threshold | Amber Threshold | Red Threshold (Forces Overall Red) |
|---|---|---|---|
| Schedule Float | 0+ days critical float | -1 to -5 days float variance | More than -5 days behind schedule |
| Milestones | All on track / completed | 1 milestone at risk | Critical-path milestone breached |
| Risks | All risks mitigated / low | Medium severity unmitigated | High/Critical severity active risk |
| Issues | Zero blocking issues | 1–2 non-blocking issues | Open blocker on critical path |
| Budget Variance | <90% of budget spent | 90% to 100% budget spent | >100% budget spent without change request |
Automated Remediation: From Red Alert to Action
When a dimension breaches safety thresholds, CoMng.AI does not just paint the screen red. The system automatically analyzes the underlying cause and drafts a targeted Change Request ready for 1-click execution.
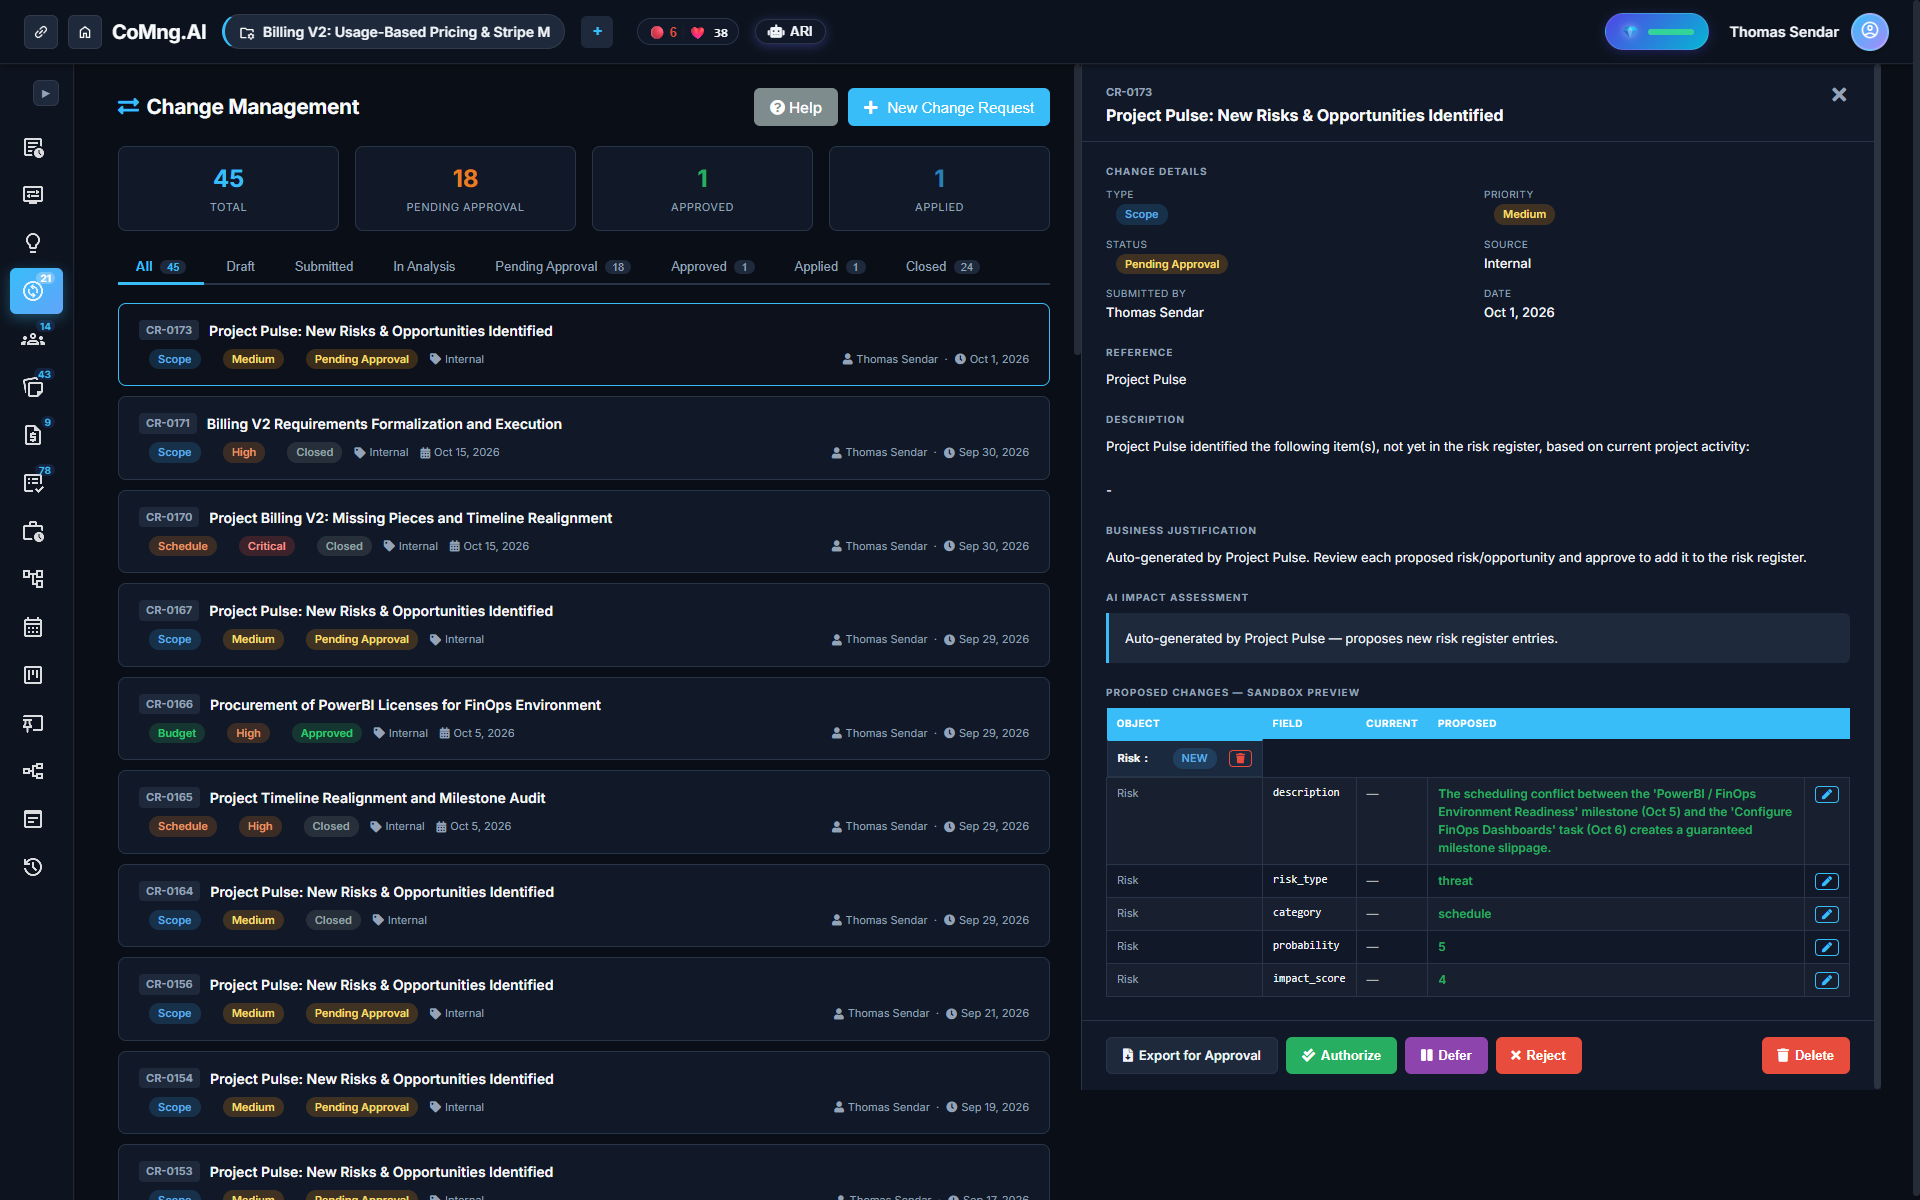
How to Run a Status Meeting Off Live Data
Transform weekly delivery meetings by abandoning PowerPoint decks:
1. Open the project's live Pulse dashboard 2. Read the daily plain-English briefing 3. Address the worst dimension first 4. Assign clear owners to active alerts 5. Skip routine round-robin status updates and focus entirely on blockers
Ready to Experience True Project Intelligence?
Try CoMng.AI today with zero setup drag. Ingest contracts, manage hybrid teams, and simulate change impacts with 5-Dimension Telemetry.
Frequently Asked Questions
What is a watermelon project?
A project reported as green that is actually red when examining the underlying data, usually caused by subjective self-reporting or mathematical averaging.
How does the overall RAG status work?
It applies the worst-of-five rule across Schedule, Milestones, Risks, Issues, and Budget: if any dimension is Red, the overall status is Red.
Can team members manually type in a Green status?
No. The Pulse score is read-only and calculated purely from mathematical project data to ensure uncompromising truth.
What happens if project data is missing?
If tasks lack dates or budget lines are unassigned, dimensions are marked Amber to flag unassessable data until corrected.