Tracking Your Timeline with the Gantt Chart
Audience: Project managers and team members who need to visualize the project schedule.
Goal: To explain how to use the Gantt Chart to see a visual representation of the project timeline, understand task relationships and durations, and track progress over time.
The Gantt Chart is a professional project management tool that displays your entire project schedule visually on a timeline. It is the best way to understand the flow of your project, see how tasks connect, and identify potential bottlenecks.
Crucial Prerequisite: A Gantt Chart is only as good as the data it uses. For this chart to be accurate and useful, you must first have well-defined Task Dependencies. We highly recommend using the AI: Suggest Dependencies feature on the Dependencies page before using the Gantt Chart.
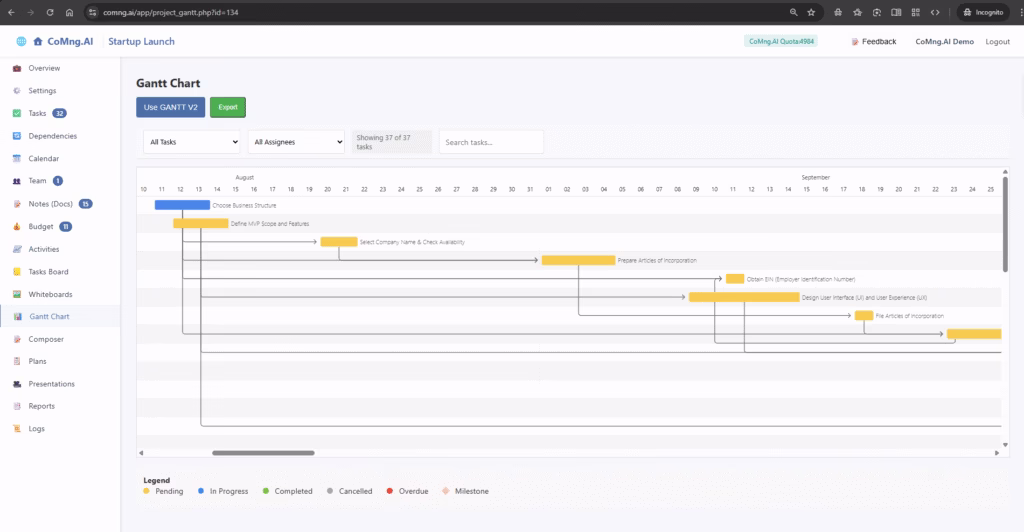
1. Navigating the Gantt Chart
To access the chart, click on Gantt Chart in the left-hand menu. The chart consists of two main areas: a task list on the left and a timeline on the right where tasks are represented as horizontal bars.
- Timeline Navigation: Use the horizontal scroll bar at the bottom to move forward and backward in time.
- Task Navigation: Use the vertical scroll bar to view all the tasks in your project.
2. Switching Between Gantt Views
CoMng.AI offers two distinct Gantt Chart views, allowing you to choose the perspective that works best for you. You can switch between them using the Use Gantt V1 / Use Gantt V2 button in the top toolbar.
Gantt V1: The Classic Dependency View
This view excels at showing the direct links and flow between tasks. The lines connecting the bars clearly illustrate the dependencies you have set up.
Gantt V2: The Modern Detailed View
This view provides a more detailed breakdown, with a dedicated task list on the left showing task names and durations. It also clearly separates Milestones (marked as MS) from regular tasks for easy identification.
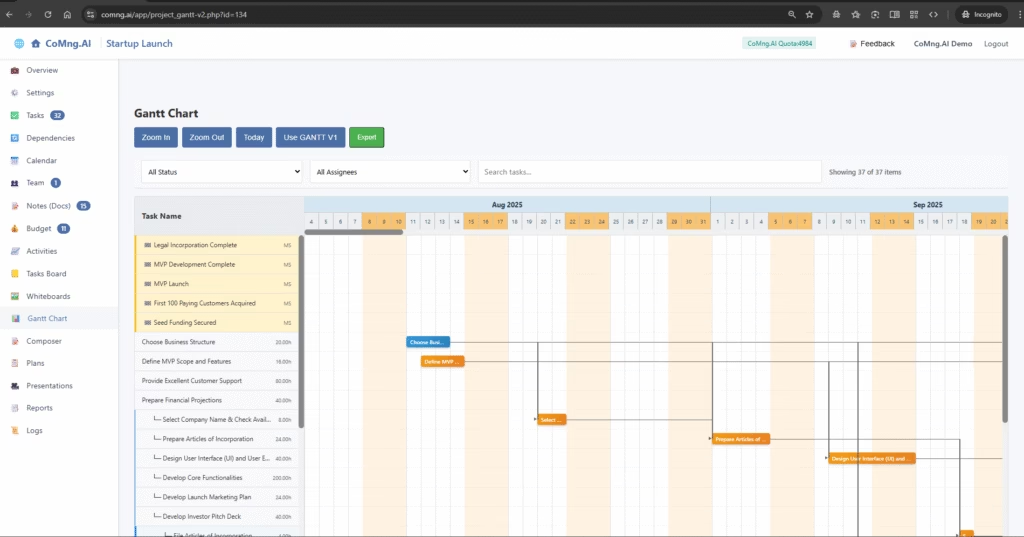
3. Using the Toolbar Controls
The toolbar at the top provides several controls to customize your view:
- Zoom In / Zoom Out: Click these buttons to get a high-level overview of the entire project or zoom in to see the details of a specific week or month.
- Today: Instantly centers the timeline view on the current date.
- Filtering and Searching: Use the dropdowns to filter the visible tasks by Status or Assignee, or use the Search tasks… bar to find a specific task.
4. Understanding the Visuals
- Task Bars: The length of each bar represents the duration of the task.
- Colors: The color of the bar indicates the task’s current status (Pending, In Progress, Completed, etc.), corresponding to the legend at the bottom of the chart.
- Milestones: These are shown as distinct markers (e.g., a diamond shape or “MS” label) on a single date, as they represent a major goal, not a duration of work.
5. Exporting Your Gantt Chart
When you need to share your project timeline in a report or presentation, click the Export button. This will generate and download an image file of the current Gantt Chart view, which can be easily embedded in other documents.
 Getting Started: Creating Your First Project
") Creating a New Project (Direct Method)
Creating a New Project (Direct Method) Understanding Your Project Overview Dashboard
 Managing Your Project’s Foundation: The Settings Page
 Mastering Task Management