Audience: All users who have just created their first project.
Goal: To explain each component of the main Project Overview dashboard so users can quickly understand their project’s status and know where to find key information.
Navigating Your Project: The Overview Dashboard
Congratulations on creating your new project! You’ve now landed on the Overview dashboard, your central command center. This page gives you a real-time, at-a-glance summary of your project’s health and upcoming activities. Let’s explore each section.
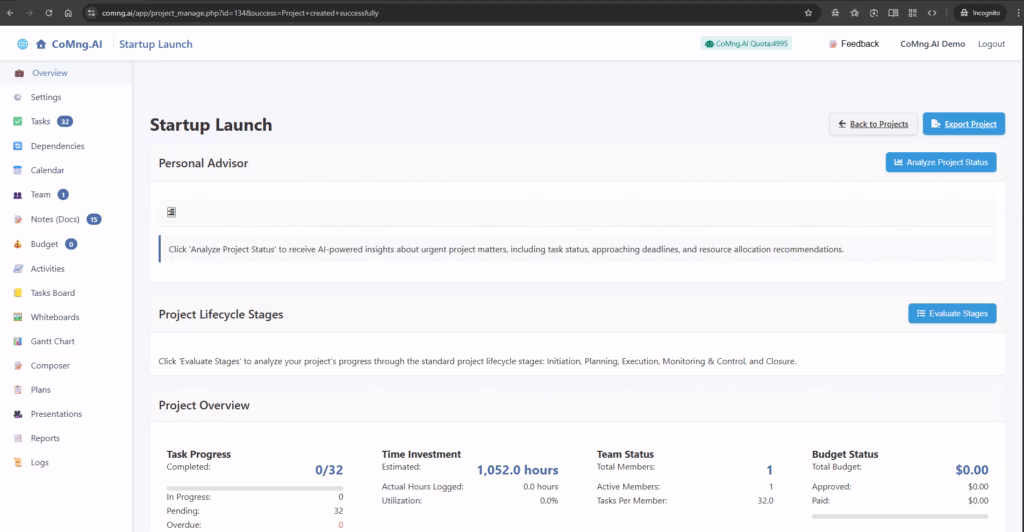
1. Personal Advisor
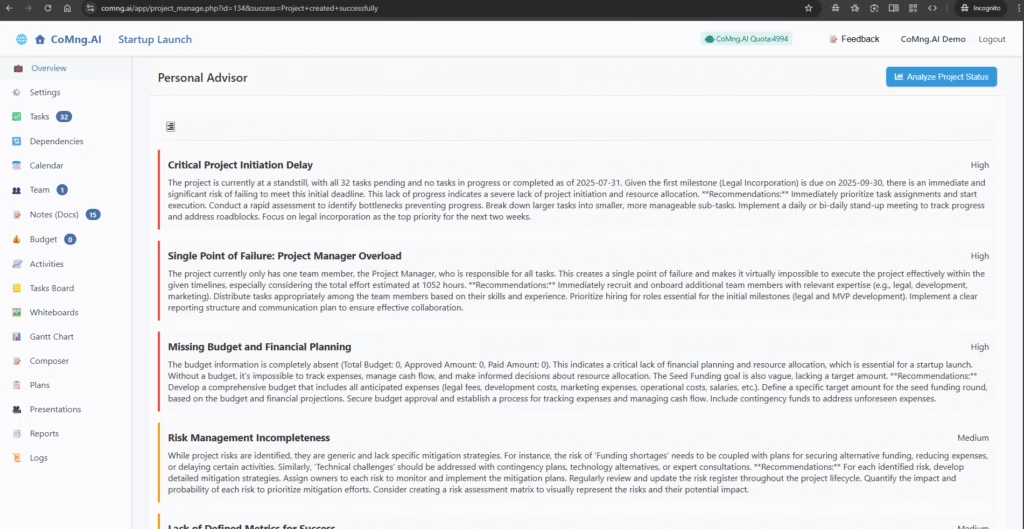
Think of the Personal Advisor as your built-in AI consultant. It’s designed to proactively analyze your project and provide high-level recommendations.
- How to use it: Click the Analyze Project Status button. The AI will assess your project’s current state—including task progress, approaching deadlines, and resource allocation—and provide actionable insights and warnings directly in this box.
- You can save the advisory as a KB Note so you can always have access to any point in time at the project status.
2. Project Lifecycle Stages
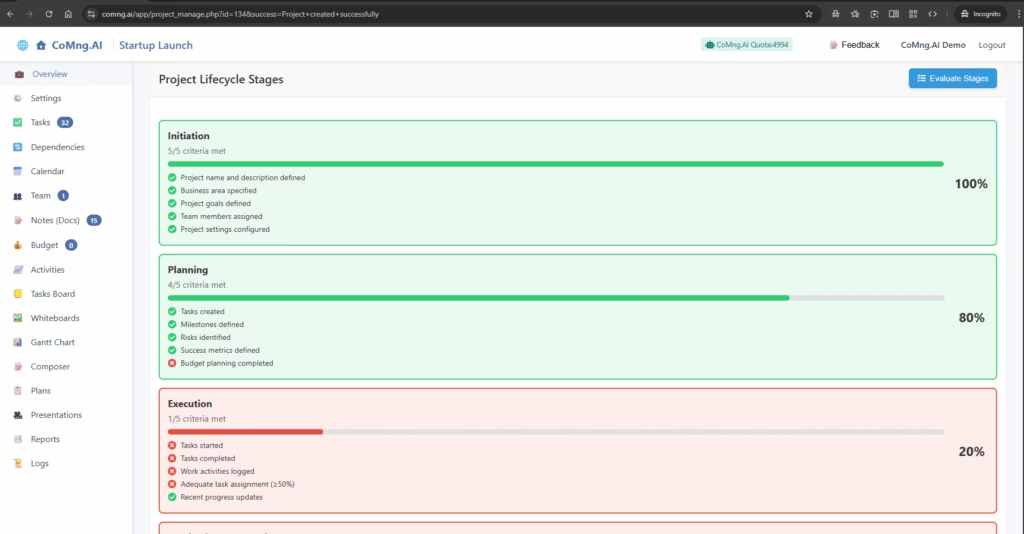
This tool helps you understand where your project stands in the grand scheme of a standard project lifecycle.
- How to use it: Click Evaluate Stages. The AI will analyze your progress and map it to the five standard phases: Initiation, Planning, Execution, Monitoring & Control, and Closure. This is useful for high-level reporting and strategic planning.
3. Project Overview At-a-Glance
This is your vital signs monitor for the project, giving you the most critical metrics in four simple cards.
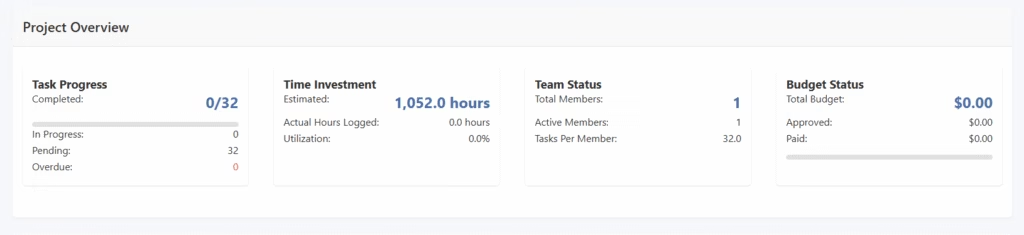
- Task Progress: Shows how much work is done versus how much is left. It breaks down the total tasks (e.g., 0/32 completed) and lists the number of tasks currently In Progress, Pending, or Overdue.
- Time Investment: Tracks the human effort on the project. It compares the total Estimated hours (calculated by the AI) against the Actual Hours Logged by your team. Utilization shows this as a percentage.
- Team Status: Gives a quick overview of your team, showing the Total Members assigned to the project and the average number of Tasks Per Member.
- Budget Status: Provides a top-level summary of your project’s finances, including the Total Budget, how much has been Approved, and how much has been Paid to vendors.
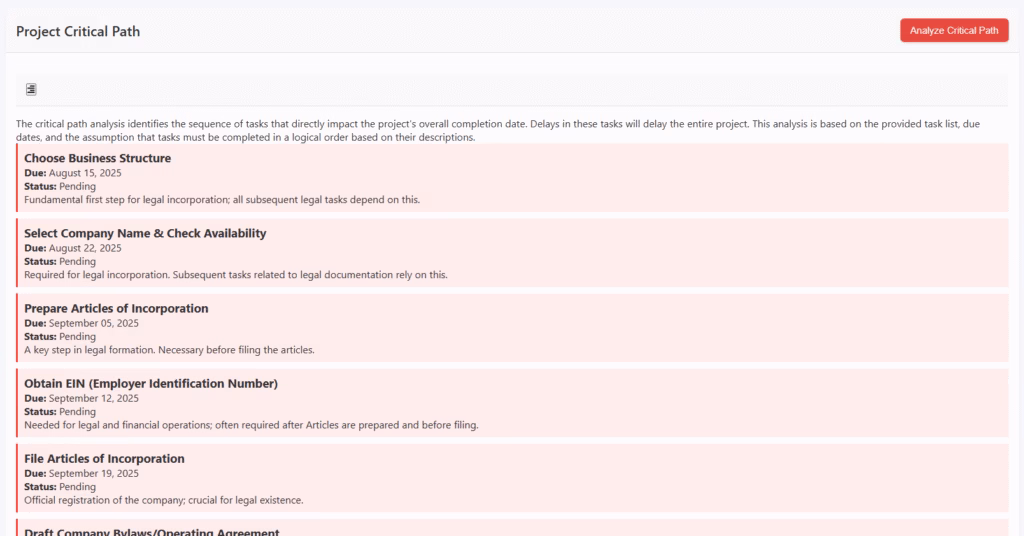
4. Project Critical Path
This is one of the most powerful analytical tools in CoMng.AI. The critical path is the sequence of tasks that directly determines the project’s earliest possible completion date. A delay in any task on this path will delay the entire project.
- How to use it: Click the red Analyze Critical Path button. The AI will identify and display this crucial sequence of tasks, allowing you to focus your management attention where it matters most to prevent delays.
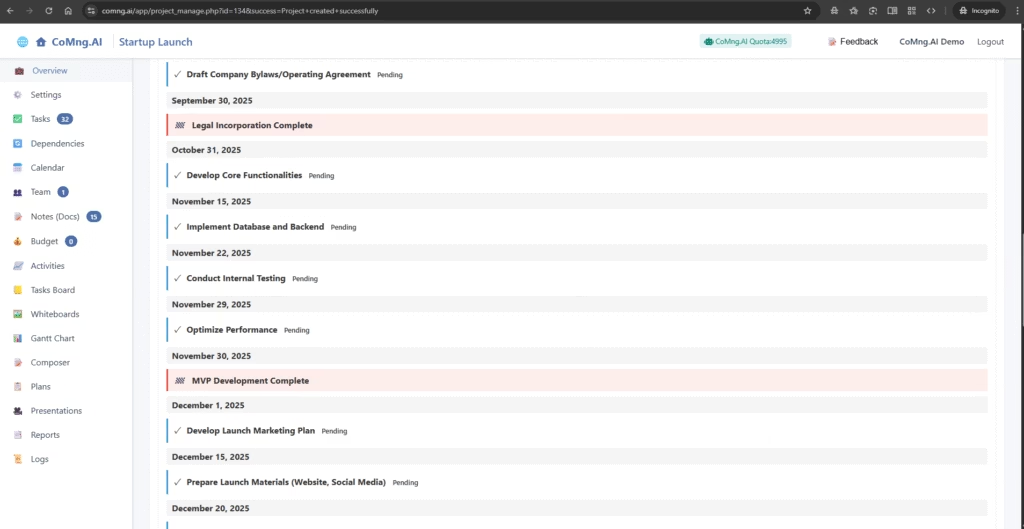
5. Project Timeline
The timeline provides a detailed, chronological feed of all your project’s scheduled events. It’s your day-to-day guide for what needs to happen and when.
- What you’ll see: You will see a list of tasks (indicated by a checkmark icon) and major Milestones (indicated by a red flag icon) ordered by their due dates.
- Save as Note: At the top right of the timeline, you’ll find a Save as Note button. Clicking this captures a snapshot of the current timeline and saves it as a permanent record in your project’s Knowledge Base. This is perfect for creating historical records for weekly reports or comparing progress over time.
Leave a Reply