Skip to content
CoMng.AI – Autonomous Execution System
  • Home
  • Contact
  • FAQ
  • Pricing
  • Blog
  • Knowledge Base
  • Who is it for?
  • Sign-inSign in or Sign up the platform
  • Facebook
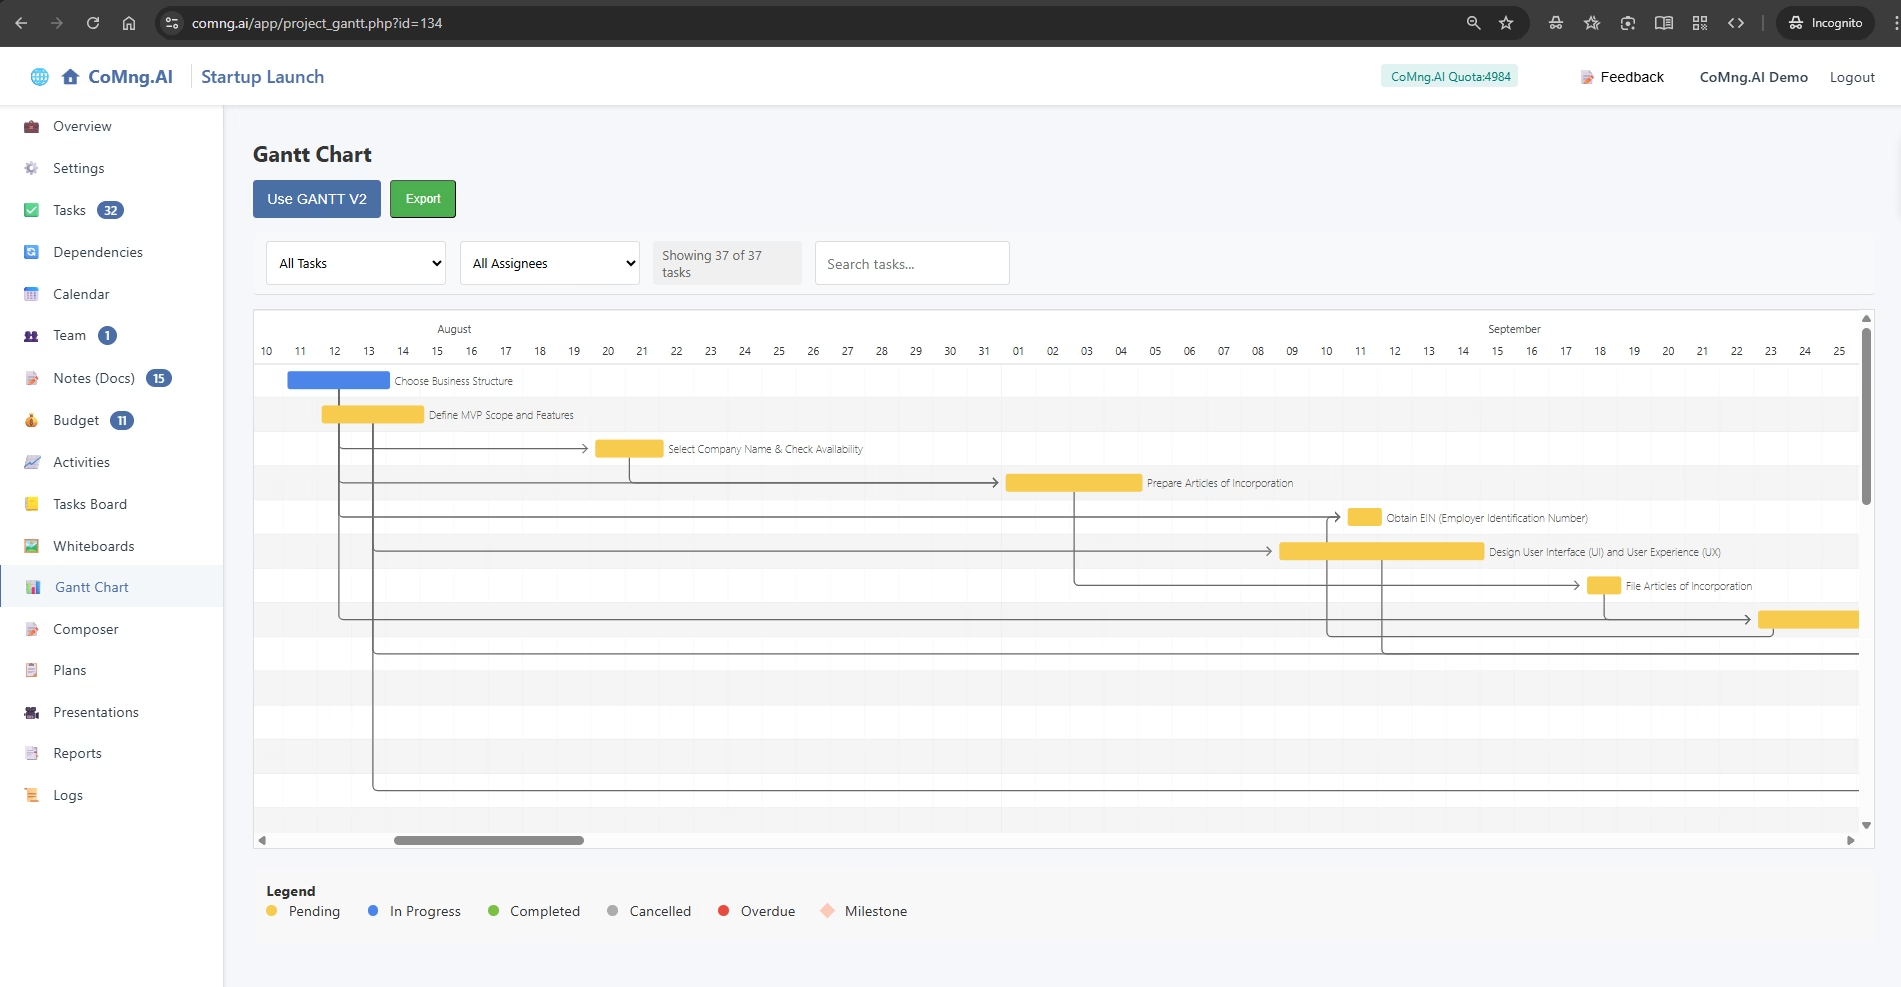
  • Visualizing Your Project Timeline with the Gantt Chart

    Visualizing Your Project Timeline with the Gantt Chart

    Explain how to use the Gantt Chart to see a visual representation of the project timeline, understand task relationships and durations, and track progress over time

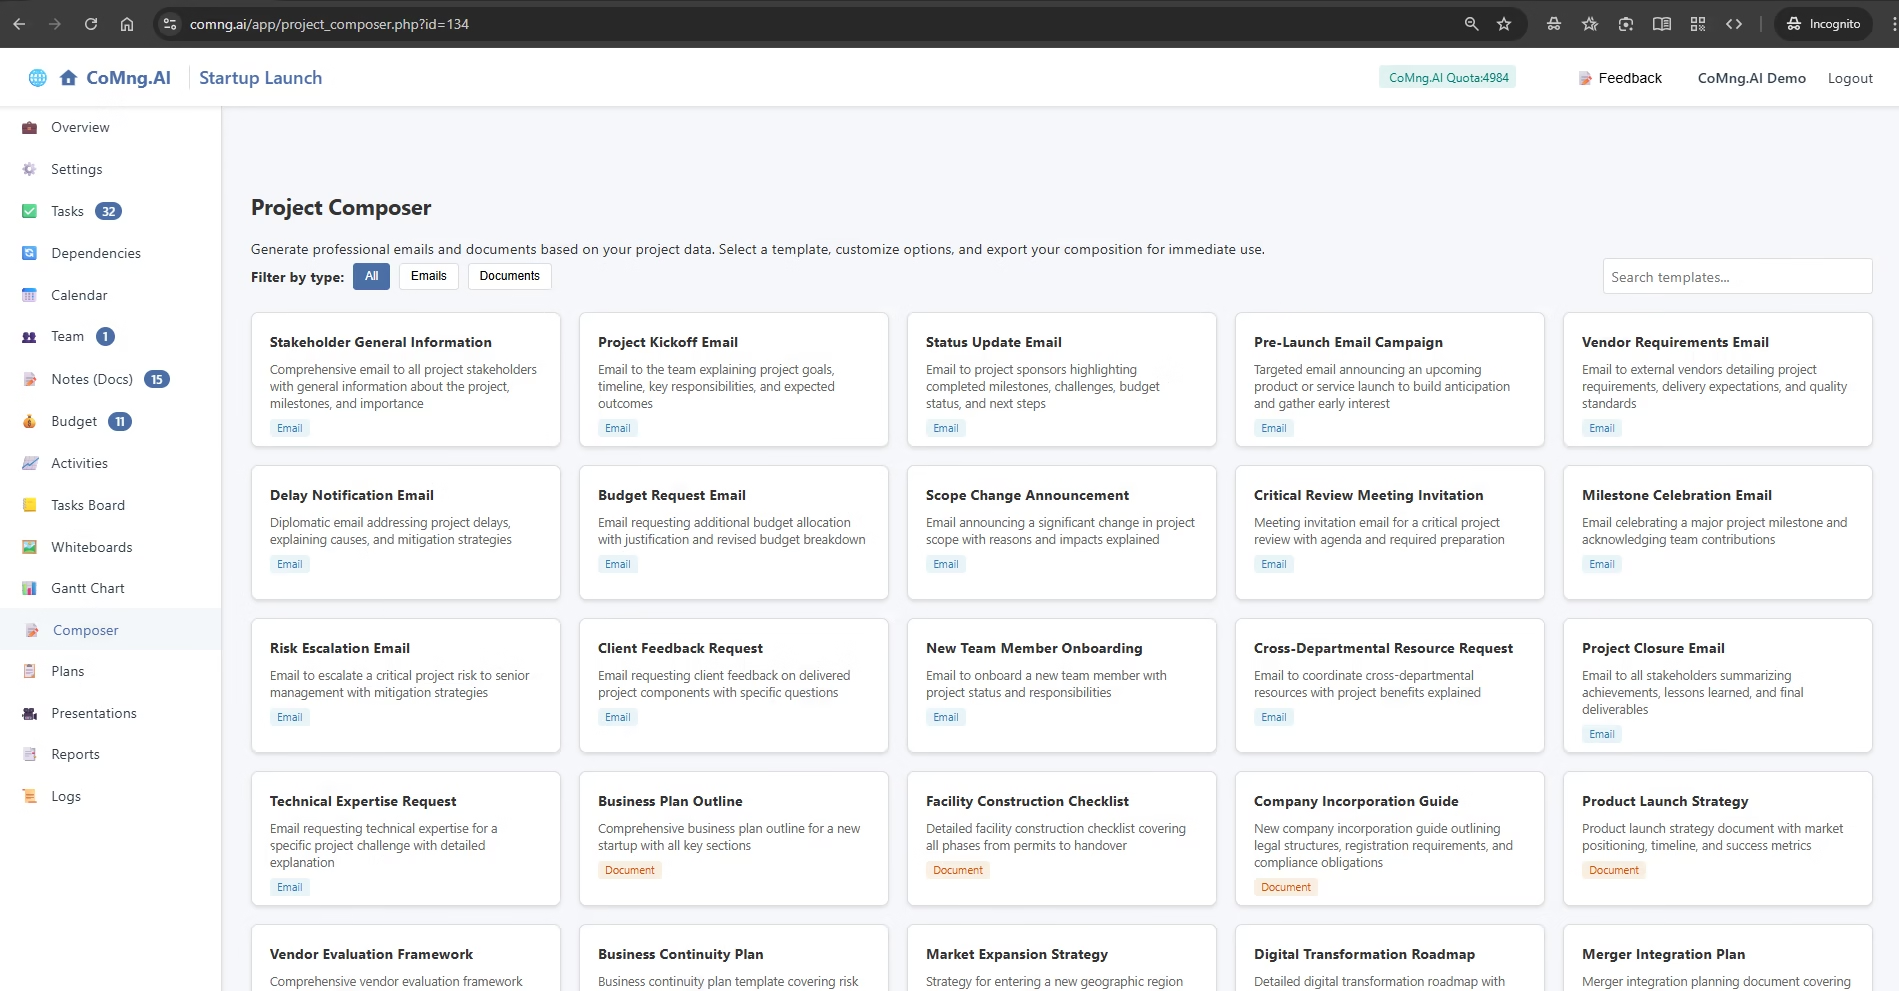
  • AI-Powered Document and Email Generation with Composer

    AI-Powered Document and Email Generation with Composer

    Explain how to use the Composer to instantly generate context-aware, professional emails and documents based on live project data

←Previous Page
CoMng.AI – Autonomous Execution System

CoMng.AI – Autonomous Execution System

  • Facebook