Most Kanban boards answer one question: what’s the status of this task?
Pending. In Progress. Done. Maybe Overdue. That’s the whole picture – and for simple projects with small teams, it’s enough.
But somewhere around 30 tasks, two team members, and a handful of parallel workstreams, “status” stops being useful as your only lens. You need to see who’s underwater. You need to surface every blocked task instantly. You need to run a standup for one person without scrolling through 59 cards looking for their name.
That’s why task management tools that only offer a status board are leaving visibility on the table. In this article, you’ll see exactly what three different Kanban views unlock – and when to use each one.
What Does “Team Visibility” Actually Mean?
Visibility in project management means anyone on the team can answer any project question in under 60 seconds – without asking someone, opening a spreadsheet, or scheduling a meeting.
How much work does Alex have? What tasks are blocked? Which items are overdue and by how much? Who’s the best person to pick up a new task right now?
Good project task management tools make those questions trivially easy to answer. Most Kanban boards answer the first one passably and the rest not at all.
Key takeaway: A single board view is a bottleneck. Different questions need different lenses – and switching between them should take one click, not a new tool.
The Problem with Status-Only Boards
Status columns were invented for manufacturing workflows in the 1940s. They work. But they were designed for linear processes – one step follows another.
Modern project work isn’t linear. A 60-task project might have 15 parallel workstreams, 3 team members with very different workloads, and a mix of risks, milestones, and blockers scattered across every status column. The classic Pending → In Progress → Done view is accurate, but it forces you to hold a mental model of everything else.
Three specific failure modes:
1. Workload blindness. The board shows task status, not person capacity. You can have one team member with 40 tasks assigned and another with 5 – and the status board looks perfectly normal.
2. Buried blockers and risks. A task tagged “Blocked” or “Risk” could sit anywhere across the five columns. Finding it means reading every card. In a 60-task project, that takes real time.
3. Standup theater. Running a team standup using a status board means everyone watches the PM scroll through all tasks, hunting for relevant ones. It’s inefficient and it subtly tells people their time doesn’t matter.
The solution isn’t a better status board. It’s understanding that status is one of three useful lenses – and having instant access to all three.
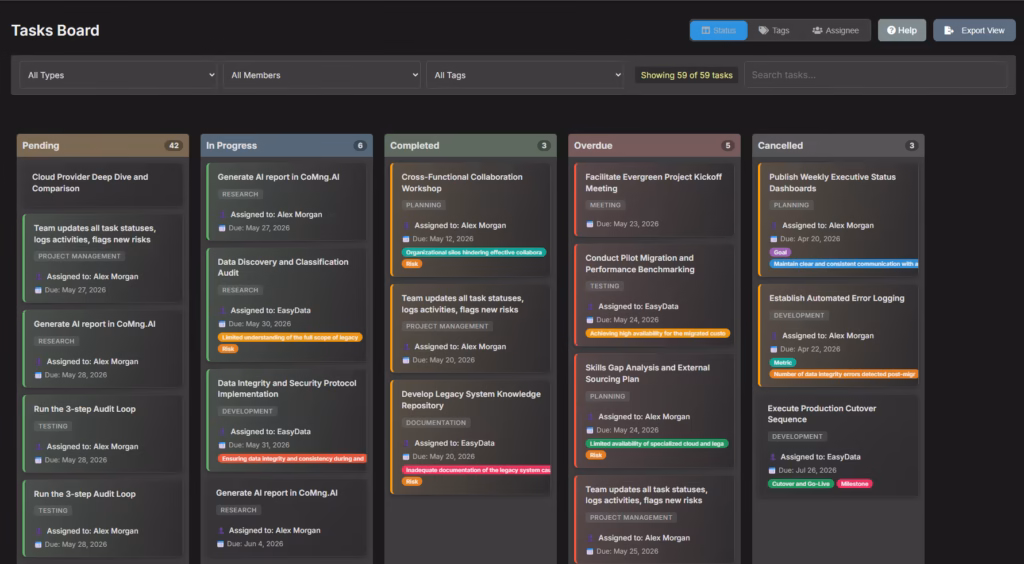
View 1: Status (The Baseline)
Status view is where most task tracking apps live permanently. In CoMng.AI it’s the default – five columns covering every possible task state.
The five columns:
| Column | Color | What it means |
|---|---|---|
| Pending | Orange | Created, not started yet |
| In Progress | Blue | Actively being worked on |
| Completed | Green | Done |
| Overdue | Red | Past due date and not finished – auto-populated |
| Cancelled | Grey | Abandoned or no longer needed |
The Overdue column is automatic and worth highlighting. A task doesn’t need to have its status manually set to “overdue” – the board detects any Pending or In Progress task whose due date has passed and surfaces it in the Overdue column automatically. The underlying status doesn’t change; the display does.
When to use Status view:
- Daily project check-ins
- Updating stakeholders on overall progress
- Moving tasks forward as work gets done (drag-and-drop updates status)
- End-of-sprint or end-of-week reviews
When Status view isn’t enough: When you need to answer questions that cut across status columns – like “show me everything tagged Risk” or “what does Sarah have on her plate” – you need a different view.
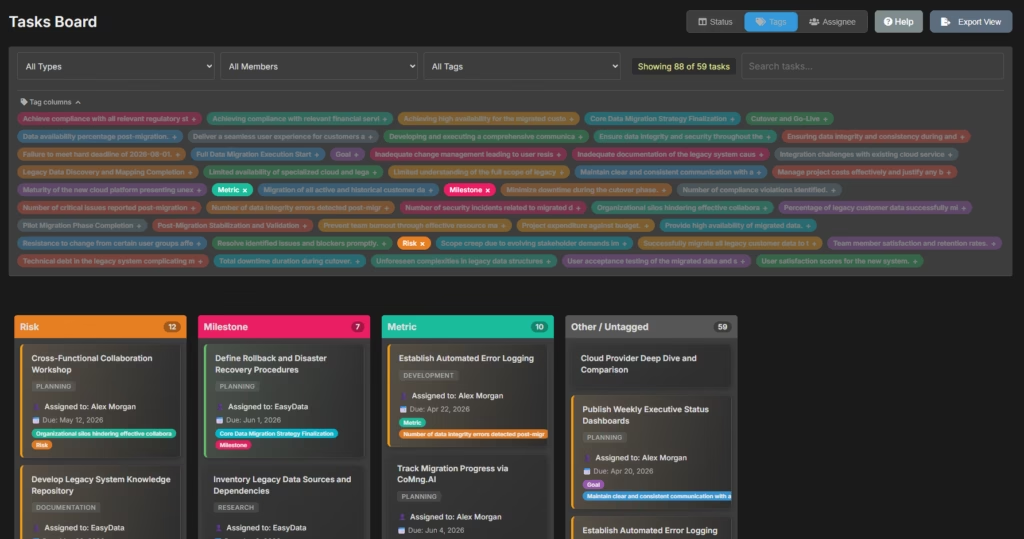
View 2: Tag (The Hidden Power Tool)
Tag view is the one most project tracking tools don’t have. It reorganizes the board around labels rather than status – and it changes what you can see.
Here’s how it works: every tag you’ve applied to tasks in your project appears as a chip in a tag selector bar. Click a chip to turn it into a column. The board instantly shows every task carrying that tag, grouped into its own column. Tasks with no active tags collect in an “Other / Untagged” column so nothing disappears.
The critical behavior that makes this powerful: a task can appear in multiple columns simultaneously. A task tagged both “Risk” and “Blocked” shows in both the Risk column and the Blocked column at the same time. It’s not duplicated – it genuinely lives in both views because it genuinely carries both labels.
What this enables:
Surface all risks instantly. Activate the “Risk” tag as a column. Every risk-tagged task across the entire project – regardless of whether it’s Pending, In Progress, or Overdue – appears in one place. In the screenshot above, that’s 12 tasks. A risk review that would normally require scanning 59 cards now takes 10 seconds.
Track milestones across workstreams. Activate “Milestone” and see all 7 milestone tasks together. You can check milestone health without caring about status – the question is “are we hitting our milestones?” not “what’s the status of task #34?”
Run a metrics review. Activate “Metric” to see every KPI-related task. With 10 metric tasks visible at once, you can assess measurement coverage across the project at a glance.
Create workstream columns. Tag tasks “Frontend,” “Backend,” “Infrastructure,” “Marketing” and you have a workstream board where parallel tracks are visible side by side. This is the Kanban equivalent of a swim lane view, built on top of any tagging scheme you already use.
When to use Tag view:
- Risk reviews – activate the Risk tag column before every risk meeting
- Milestone check-ins – Milestone tag column gives you the critical path at a glance
- Sprint planning – use workstream tags to see parallel workstreams side by side
- Escalation prep – activate a “Blocked” or “Escalate” tag to quickly find items needing attention
One important note: drag-and-drop is disabled in Tag view. Tag columns represent label membership, which you can’t change by dragging. To change tags, open the task. To change status or assignee, switch to the appropriate view.
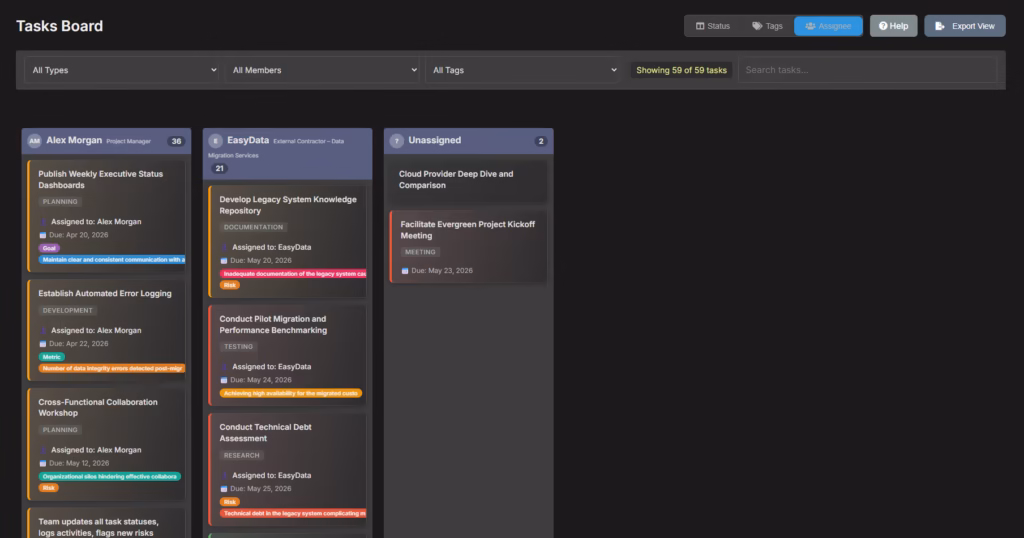
View 3: Assignee (The Workload Balancer)
Assignee view does one thing extremely well: it shows you exactly what each person on your team is carrying.
Each active project member gets their own column. Their initials appear in a small avatar, their name and role show in the header, and their task count updates as you apply filters. An Unassigned column collects any tasks with no owner.
What you can see immediately:
- Alex Morgan: 36 tasks
- EasyData: 21 tasks
- Unassigned: 2 tasks
That’s a 36 vs. 21 split – and now the workload conversation has data behind it. Without Assignee view, that imbalance is invisible unless someone raises it.
The drag-and-drop superpower: In Assignee view, you can drag a task directly from one person’s column to another’s. The reassignment saves instantly. No editing forms, no dropdowns, no confirmation screens – just move the card and the owner changes.
This is particularly useful during sprint planning or after a team member becomes unavailable. You can redistribute 5–10 tasks in under 2 minutes by dragging, rather than opening each task individually.
Cards still show priority borders in Assignee view. Red border = overdue, orange = due today, green = due within 7 days. So urgency is visible even without the status column context.
When to use Assignee view:
- Start of a sprint – review who has what before committing to the sprint scope
- Workload balancing – drag tasks from overloaded members to those with capacity
- One-on-one meetings – filter to that person and walk through their tasks together
- Standup mode – filter by member, see only their cards, move through the team quickly
Note: Assignee view drag-and-drop only changes the assignee. It does not update task status. If you need to do both, you’ll make the move in two views – one drag in Assignee, one drag in Status.
How the Three Views Work Together in Practice
The views aren’t alternatives – they’re a rotation. Here’s how a project manager might move through them in a single day:
Morning standup (10 minutes): Start in Assignee view. Filter to each team member in turn. Walk through their active and overdue items. Drag any reassignments needed. Switch to Status view to confirm overall progress before the meeting ends.
Risk review (5 minutes): Switch to Tag view. Activate the Risk column. 12 tasks appear. Check the ones in Overdue first (red priority border). Escalate anything that’s been Overdue and risk-tagged for more than a day.
Sprint planning (20 minutes): Stay in Assignee view. Look at the Pending column count per member. Drag tasks from an overloaded member to someone with capacity. Switch to Tag view with workstream columns to confirm parallel tracks aren’t bottlenecked on one person.
Stakeholder update prep: Switch to Status view. Export the board as a PNG with one click (Export View button, top right). Send it. Done.
All of this happens in one screen. No extra tools, no separate reports, no waiting for someone to pull data.
Putting It Into Practice: CoMng.AI’s Kanban Board
Most kanban features in project management tools are cosmetic – a nicer way to see the same task table. The three-view system in CoMng.AI is architecturally different.
All three views read from the same task data. A tag you add on the Tasks page shows up in Tag view immediately. An assignee change you make in Assignee view is reflected in Status view instantly. There’s no sync step, no export/import cycle, no separate board to maintain.
The Tag view is genuinely novel. Most tools that offer any kind of alternative view stop at “group by assignee.” The ability to turn any tag into a column – and have tasks appear in multiple tag columns simultaneously – is the kind of feature that only makes sense when tagging is built into the system from day one, not bolted on later.
The AI enriches what you see. Priority borders on every card (red/orange/green) are calculated in real time based on due dates – they’re not a field you set. Cards show type badges, tag pills, and assignee names consistently across all three views. When you click a card to open the Task Details panel, you see AI-generated effort estimates, required resources, and success factors alongside the standard fields.
This is what an AI co-manager looks like on a Kanban board. Not a chatbot you ask for task suggestions – a system that reasons about your project data and surfaces what matters, in whatever lens you need at that moment.
A Quick Decision Guide: Which View, When
| The question you’re asking | Use this view |
|---|---|
| What’s the overall project health right now? | Status |
| What work is overdue or at risk? | Status (Overdue column) or Tag (Risk column) |
| Who has too much / too little work? | Assignee |
| Can I reassign tasks without opening forms? | Assignee (drag-and-drop) |
| What are all the risks across the project? | Tag (activate Risk column) |
| Are we hitting our milestones? | Tag (activate Milestone column) |
| What does this workstream look like across the team? | Tag (workstream tag columns) |
| I need a board screenshot for a status report | Status or Tag + Export View |
| I’m running a standup for one person | Assignee + Member filter |
Getting Started
If you’re already using CoMng.AI, the toggle is in the top-right toolbar of the Tasks Board. Status | Tags | Assignee – one click each. Your choice persists per project so you don’t have to reset it each session.
If you’re evaluating ai project management platforms and Kanban is part of your decision: ask specifically whether the tool offers tag-based columns and assignee view. CSV imports and status boards are table stakes. The ability to create a Risk column or a Blocked column from your existing tags – without building a separate board – is what separates a real task tracking app from one that just looks good in demos.
Ready to see all three views on your own project? Start free at CoMng.AI – your tasks board is ready the moment your project is created.
Relevant reading:
- History of Kanban boards (Toyota Production System) – invented for manufacturing workflows in the 1940s
- Project Management Institute on visual management – project visibility best practices
Leave a Reply