-
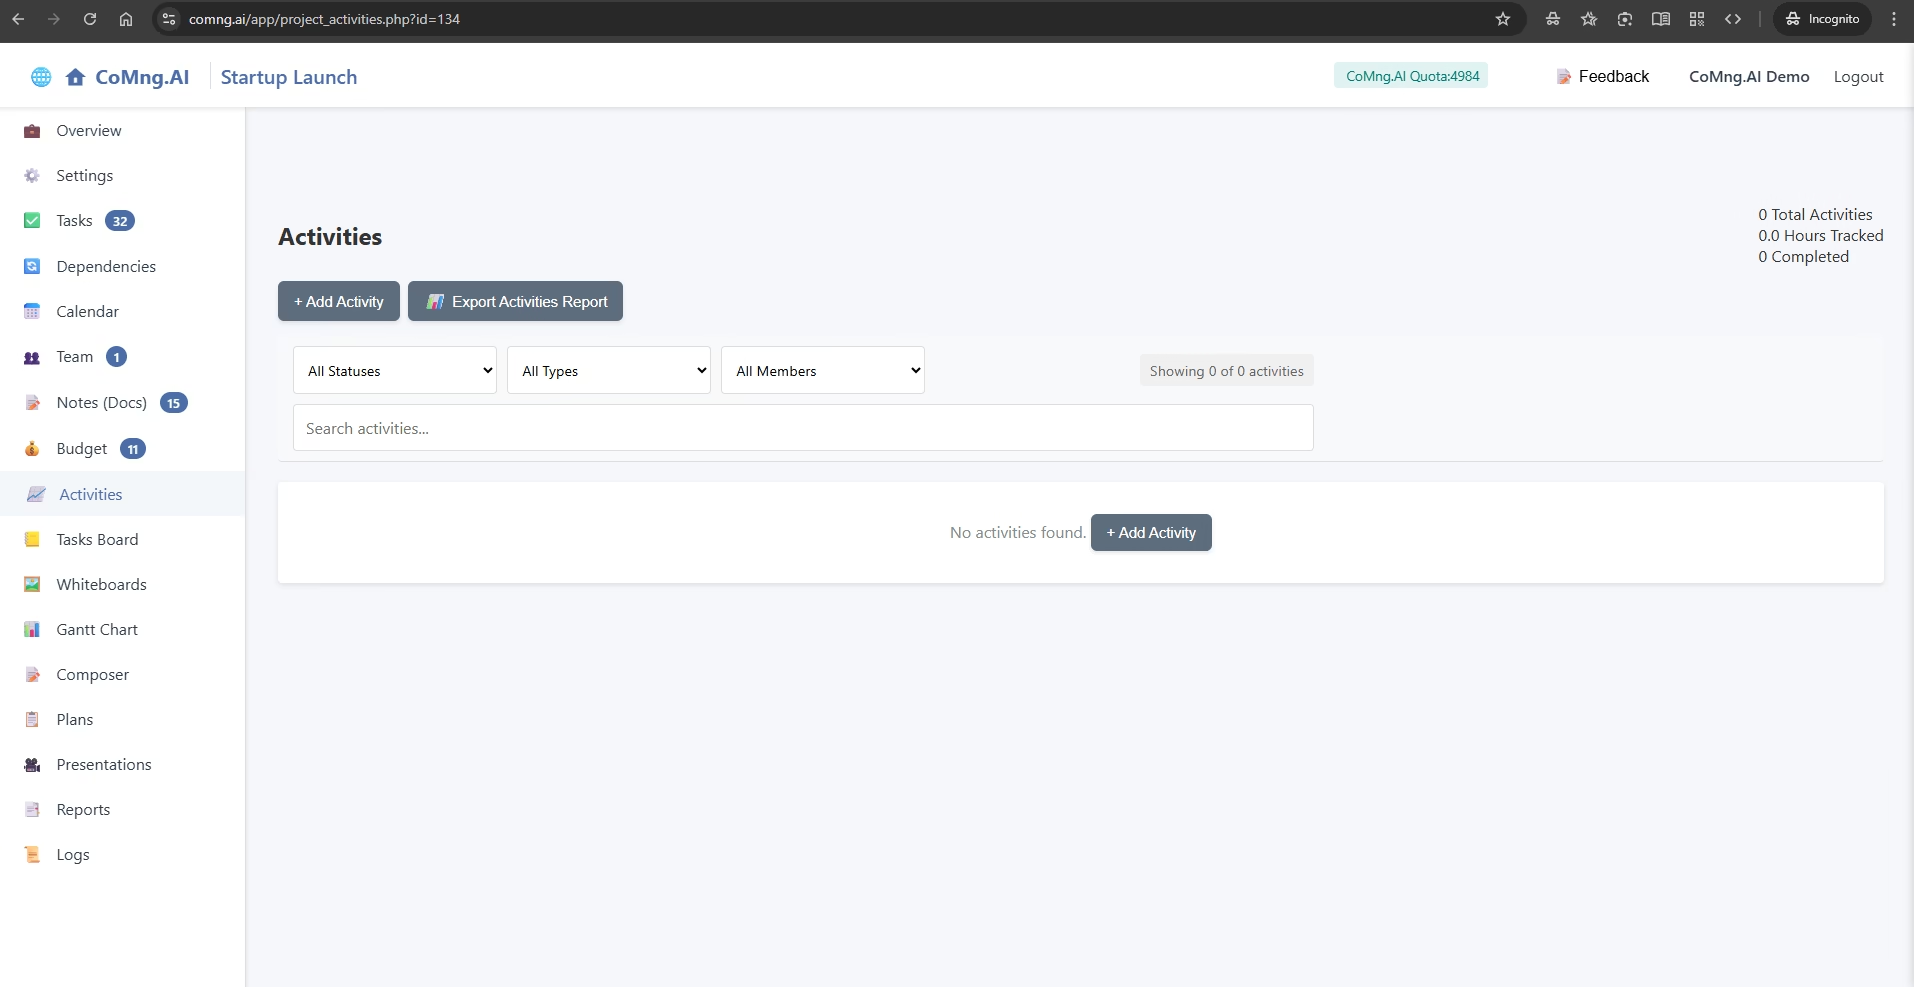
Tracking Time and Effort with Activities
Explain how to log time and report work in the Activities section, and how this data impacts project-level reporting
-
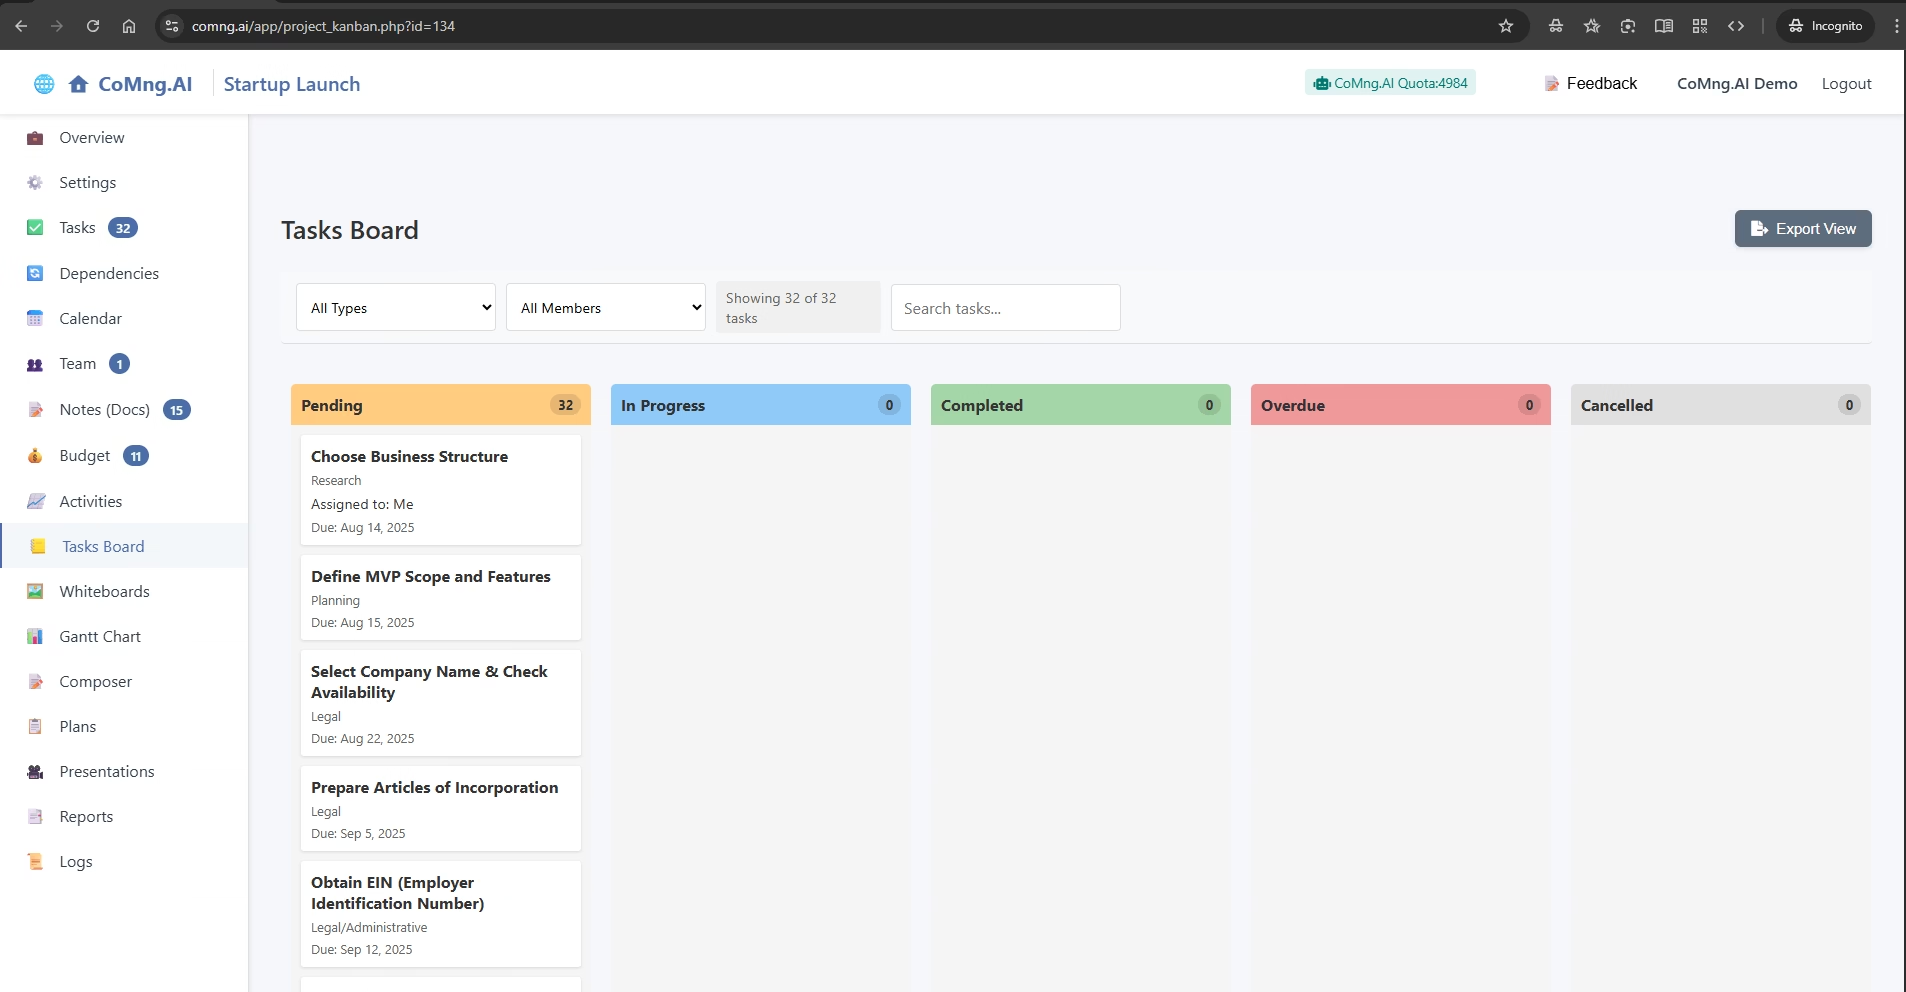
Visualizing Your Workflow with the Task Board
Explain how to use the Kanban-style Task Board to visually track and update task statuses using a simple drag-and-drop interface
-
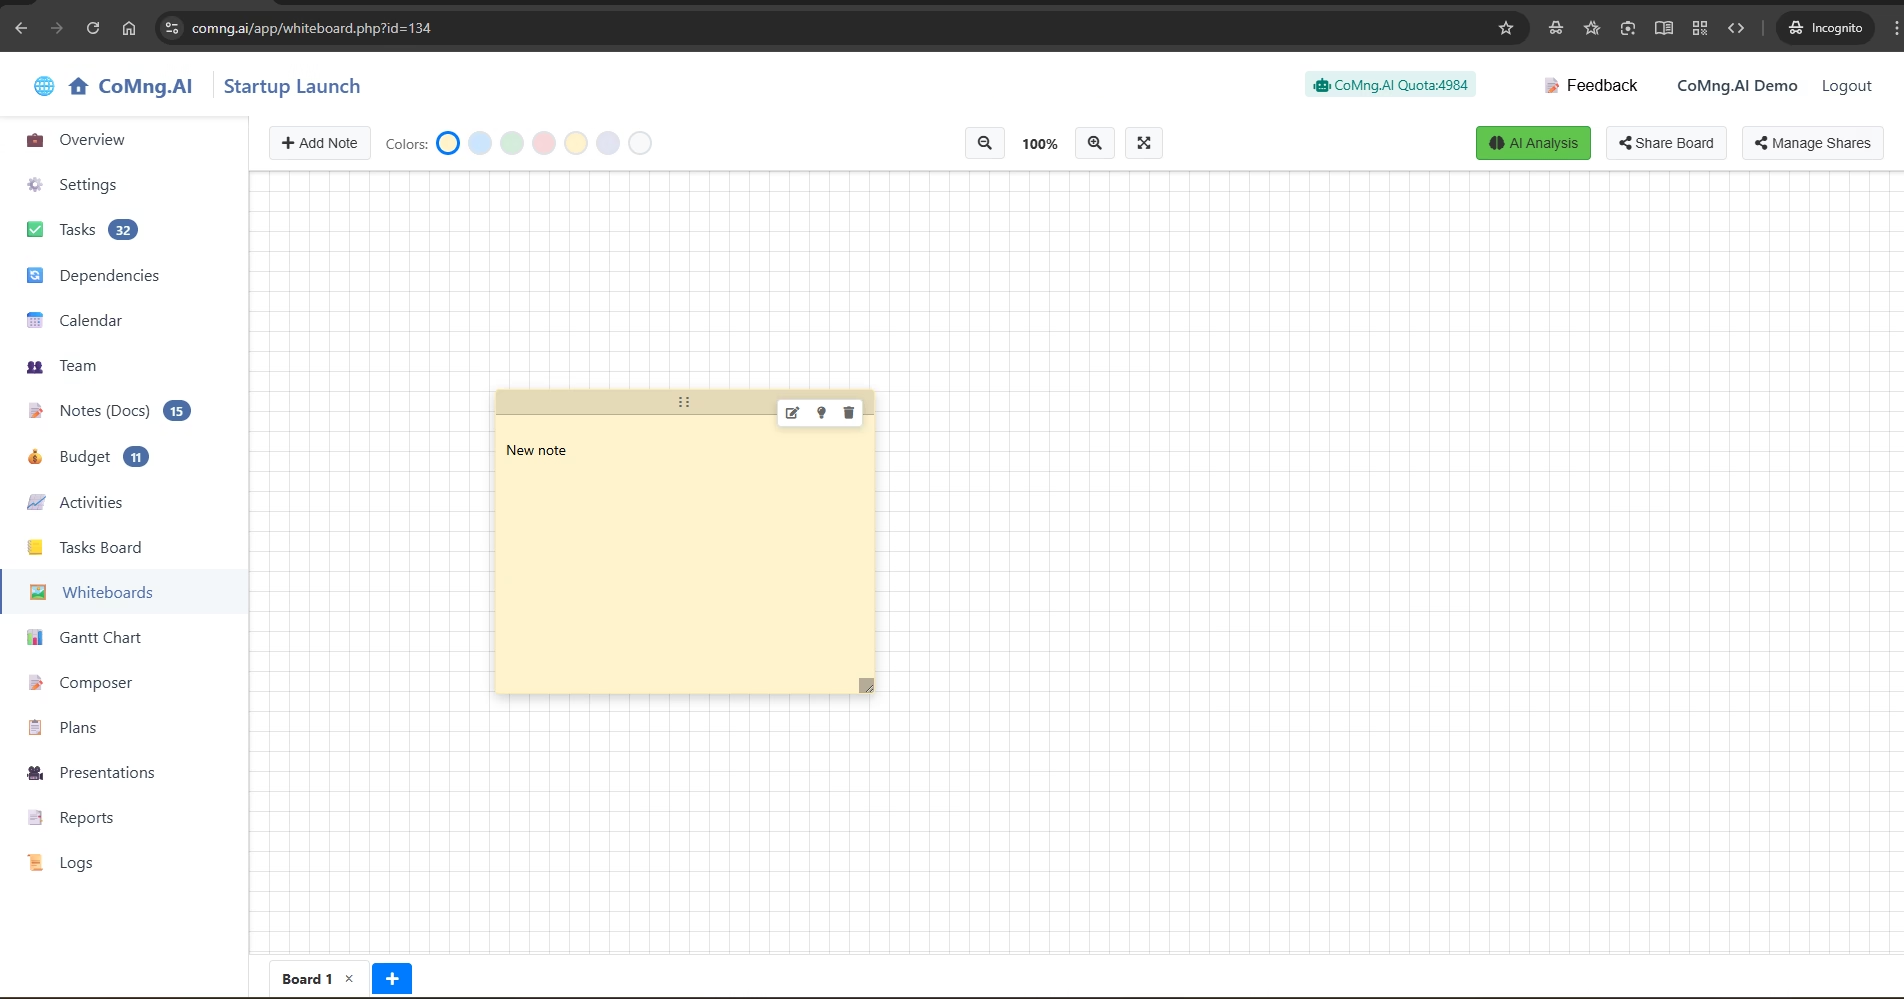
Brainstorming and Ideation with Digital Whiteboards
Explain how to use the freeform Whiteboard feature for brainstorming with sticky notes and how to leverage its powerful AI analysis and sharing capabilities
-
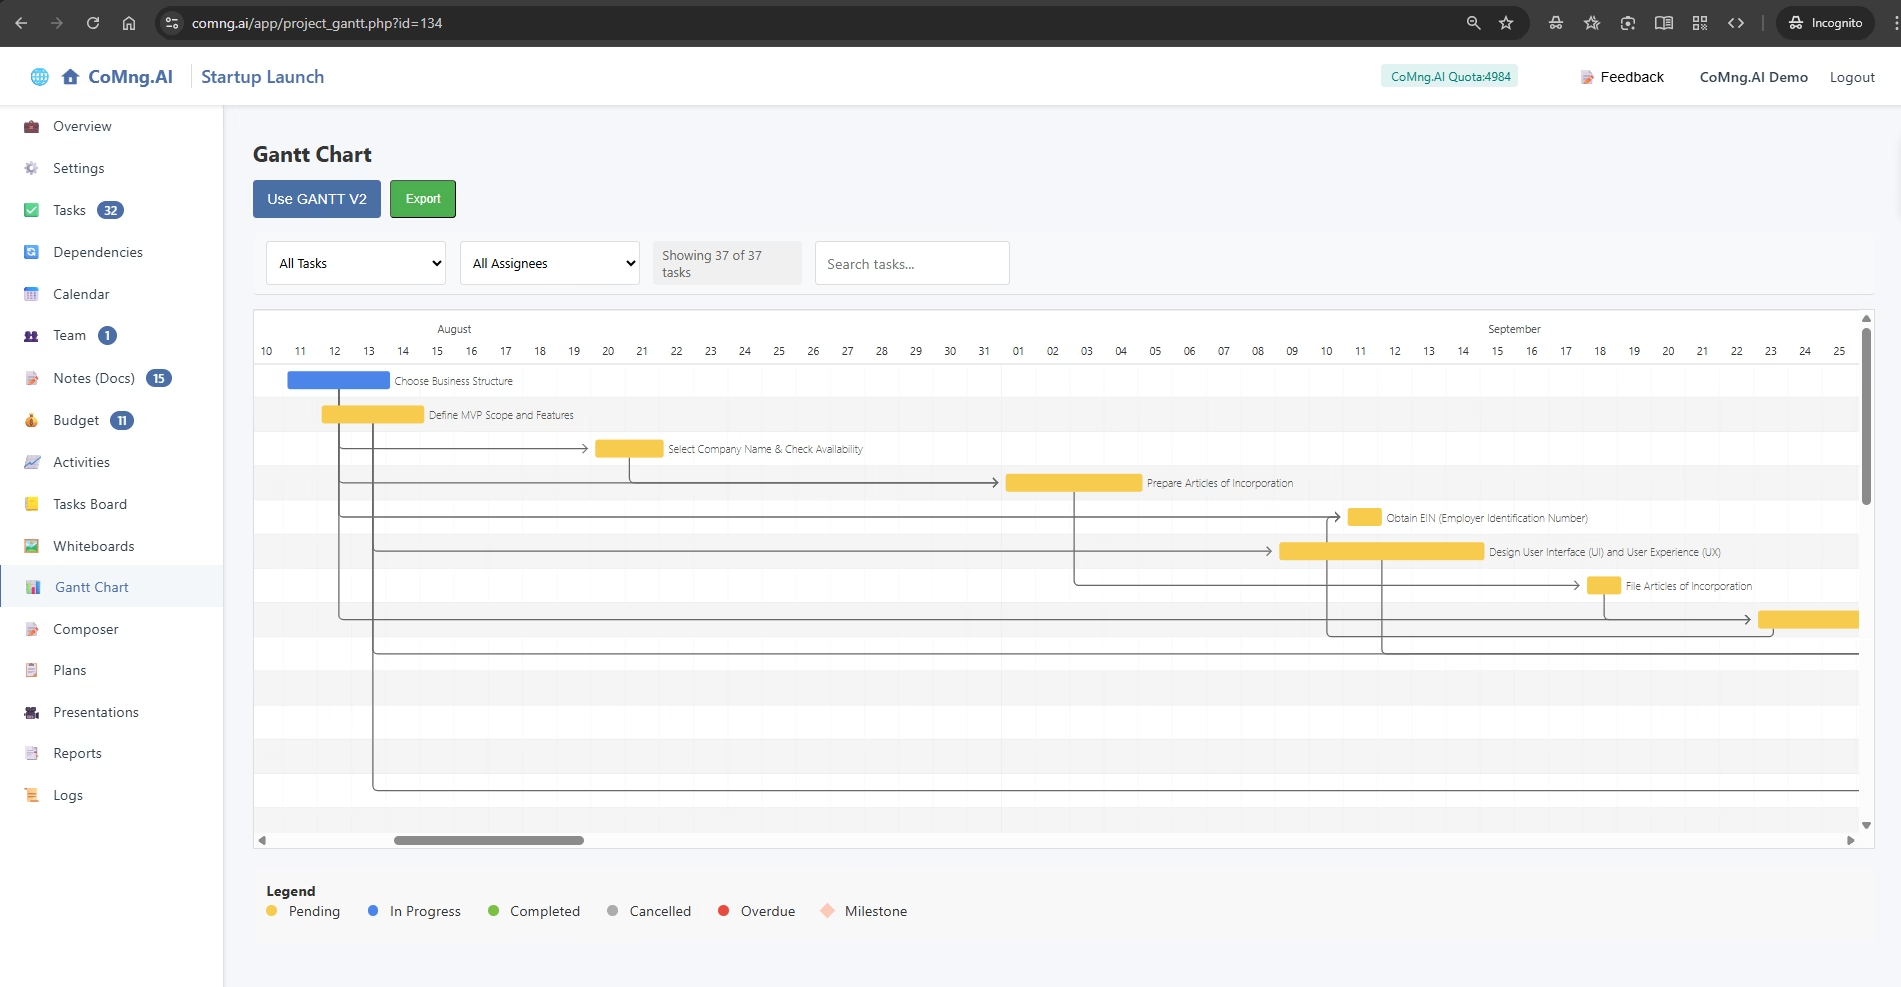
Visualizing Your Project Timeline with the Gantt Chart
Explain how to use the Gantt Chart to see a visual representation of the project timeline, understand task relationships and durations, and track progress over time
-
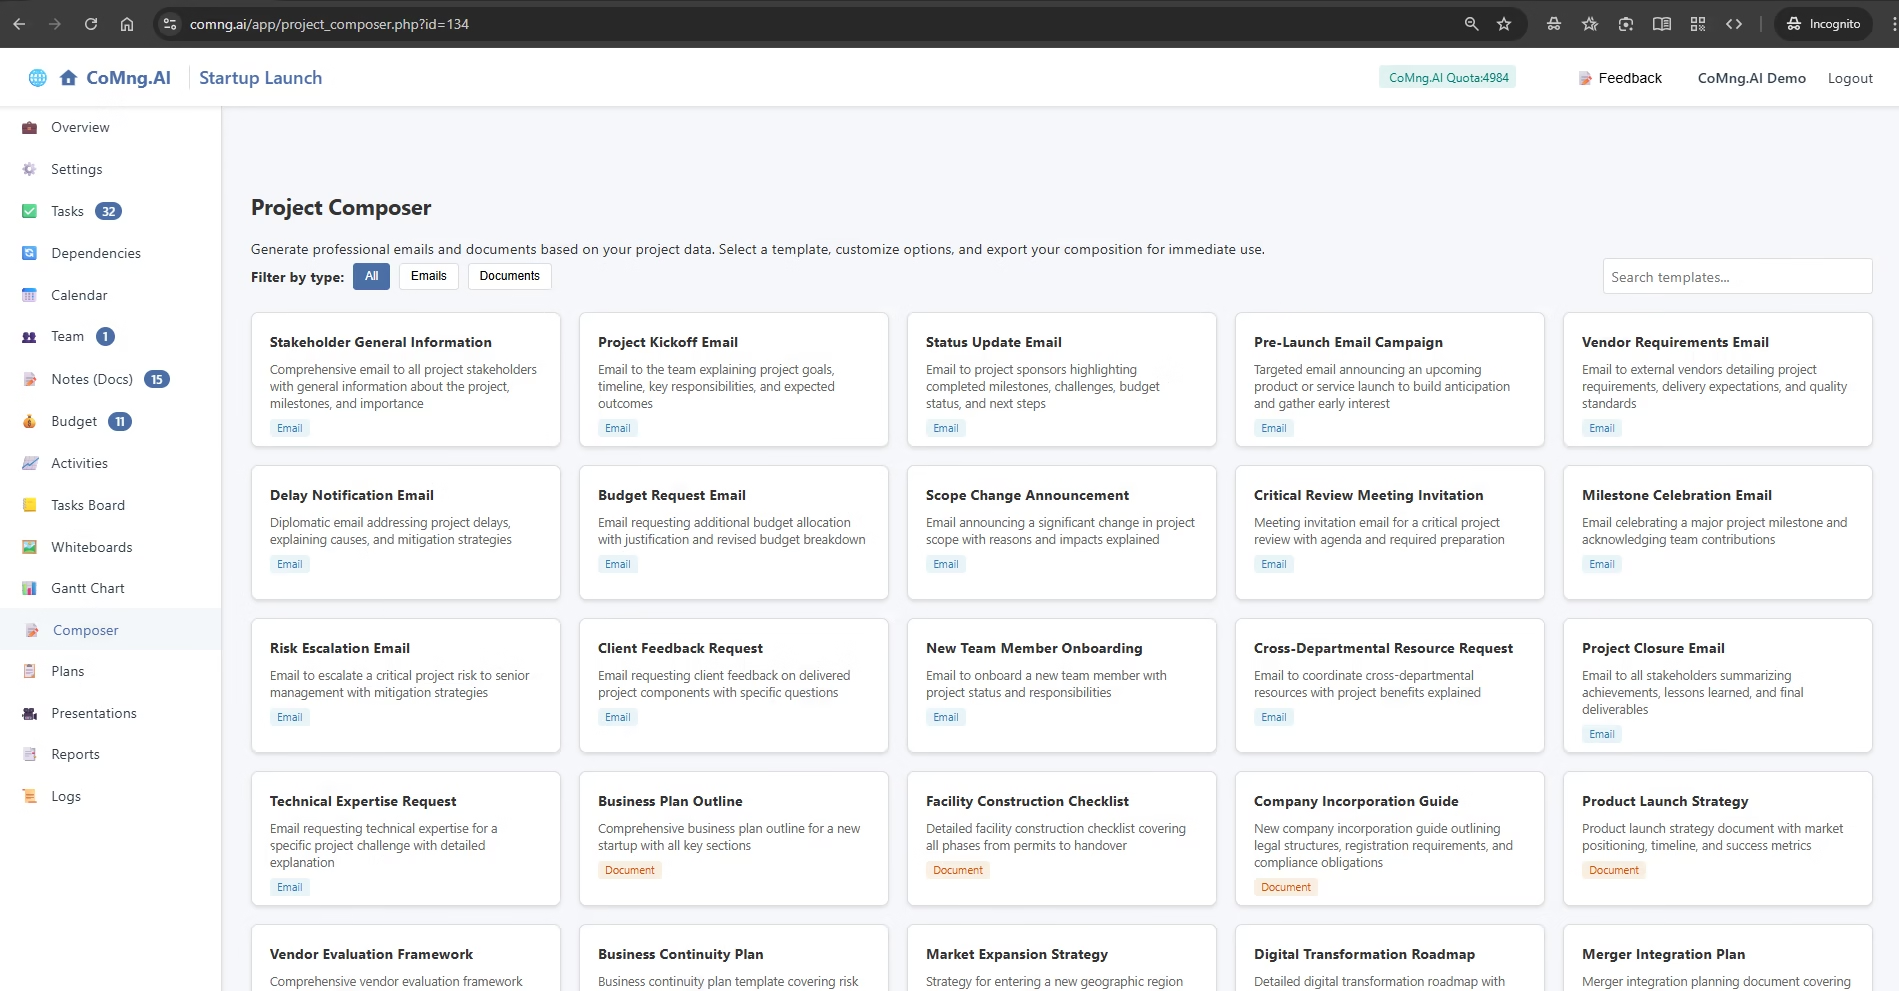
AI-Powered Document and Email Generation with Composer
Explain how to use the Composer to instantly generate context-aware, professional emails and documents based on live project data
-
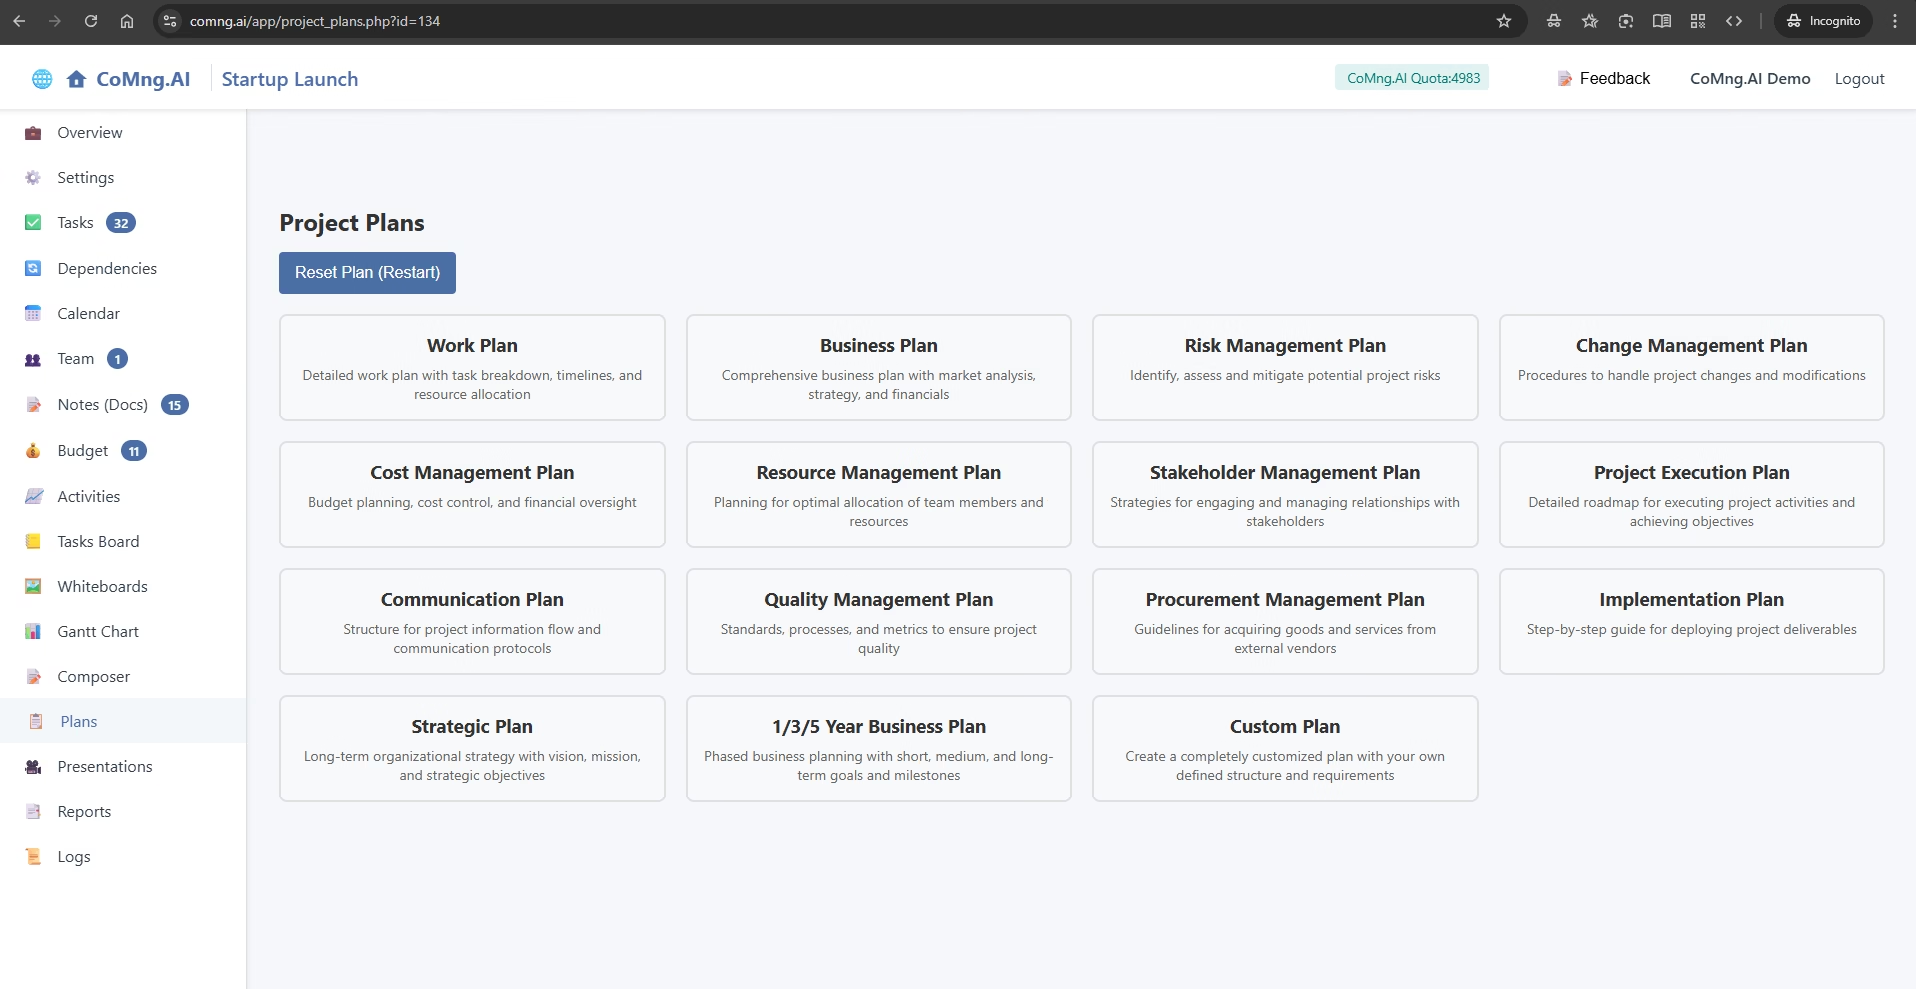
Generating Strategic Documents with Project Plans
Explain the powerful three-step process for using the Project Plans generator to create comprehensive, data-driven strategic documents like Business Plans, Work Plans, and more
-
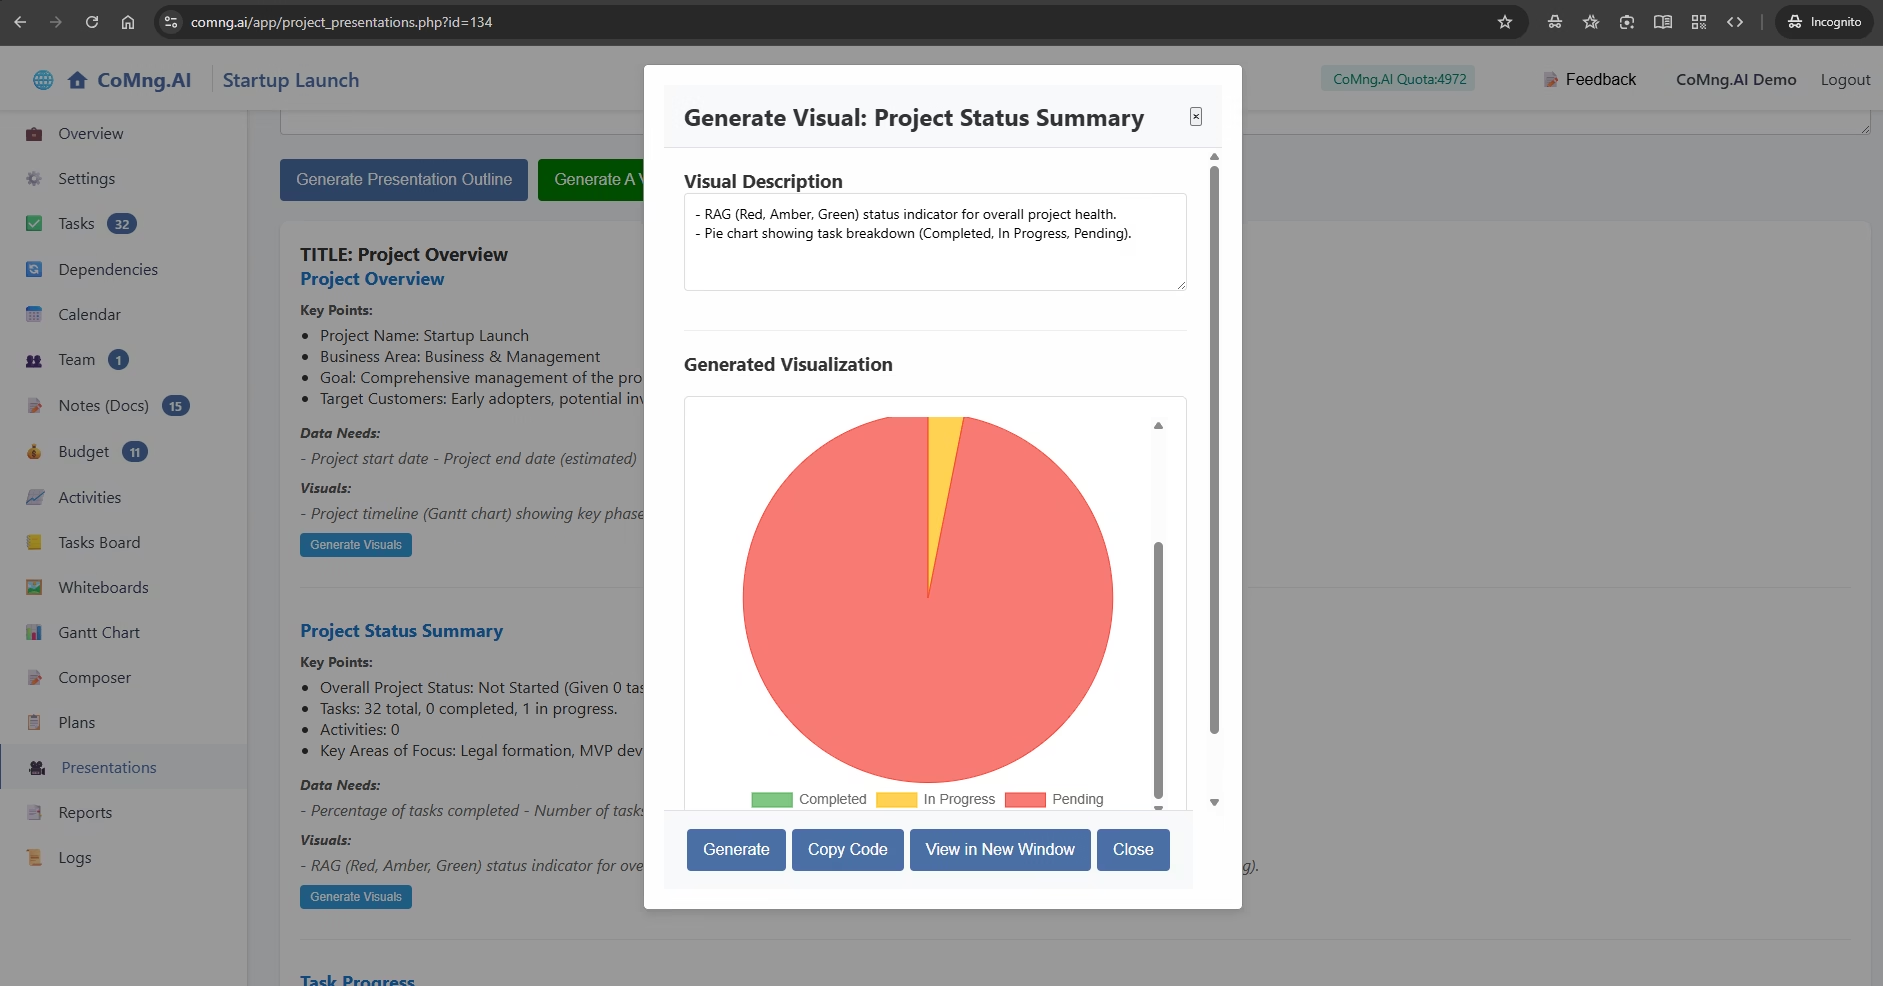
Building Compelling Presentations with the AI Generator
Explain how to use the Presentation Generator to rapidly create detailed outlines and supporting visuals for a wide variety of project-related presentations
-
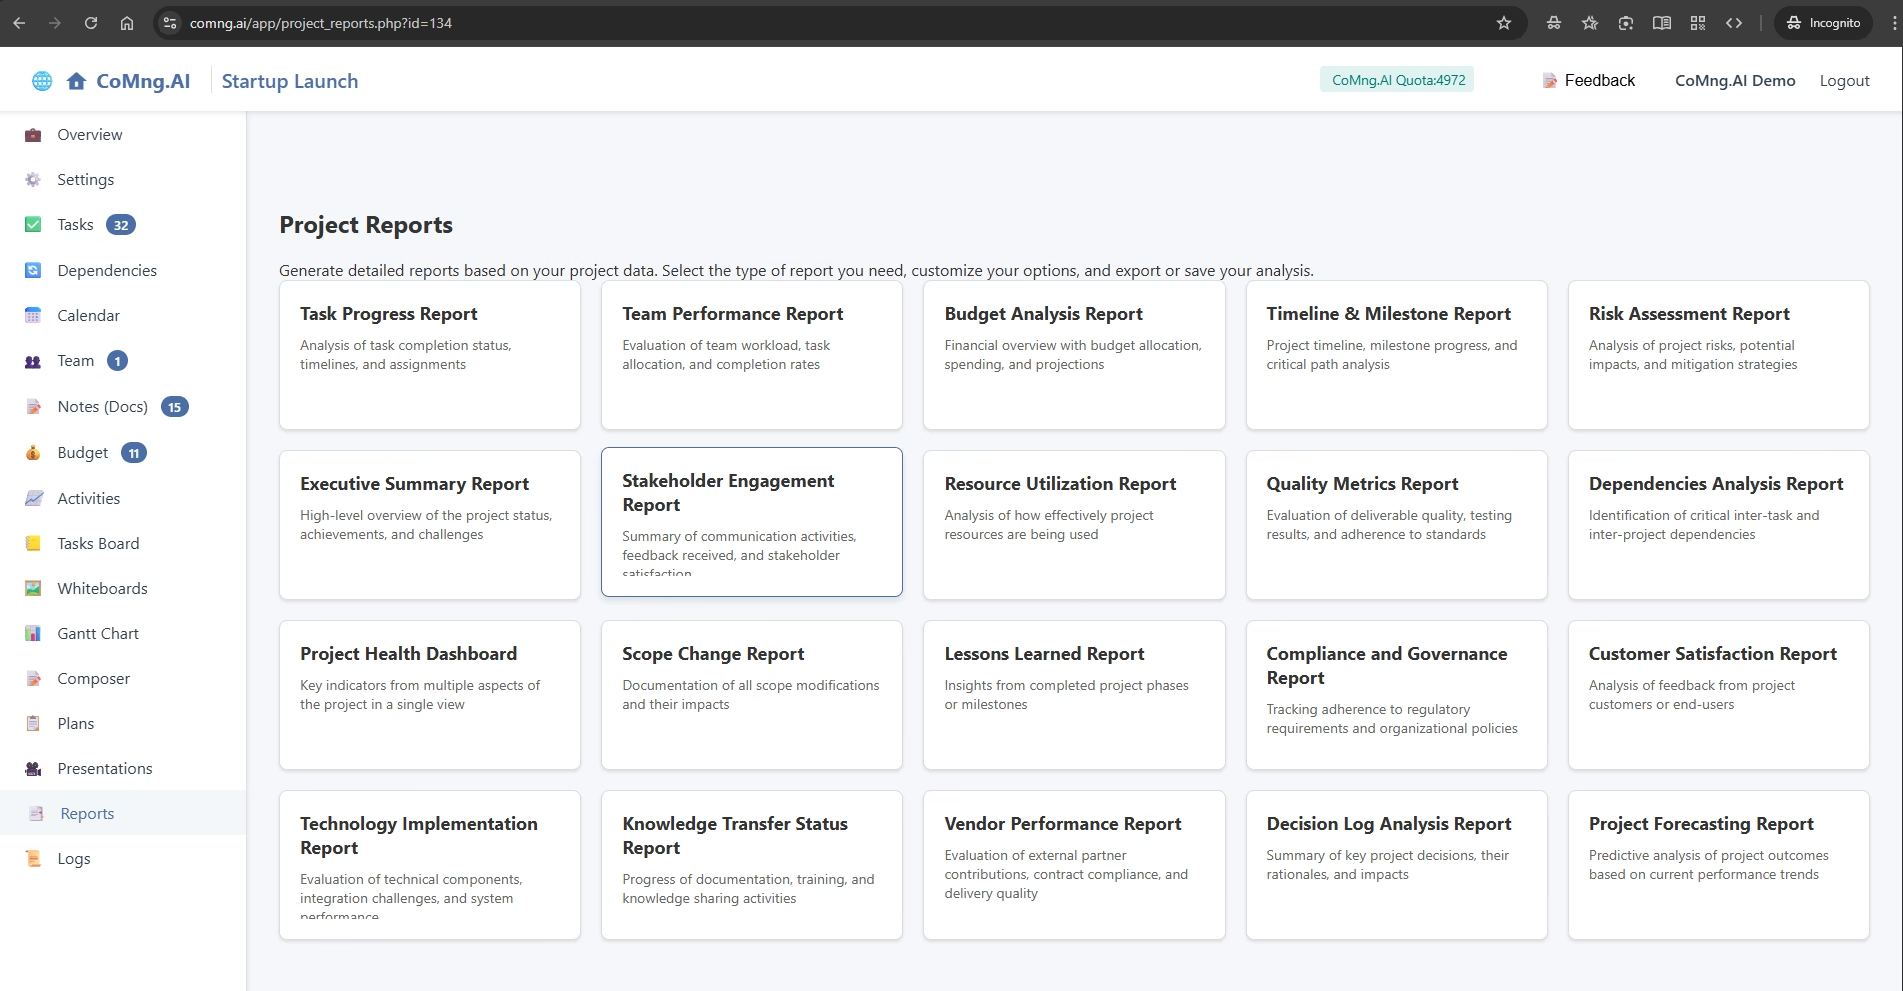
Creating Data-Driven Reports with the AI Generator
Explain how to generate, customize, and save a wide variety of analytical reports based on live project data
-
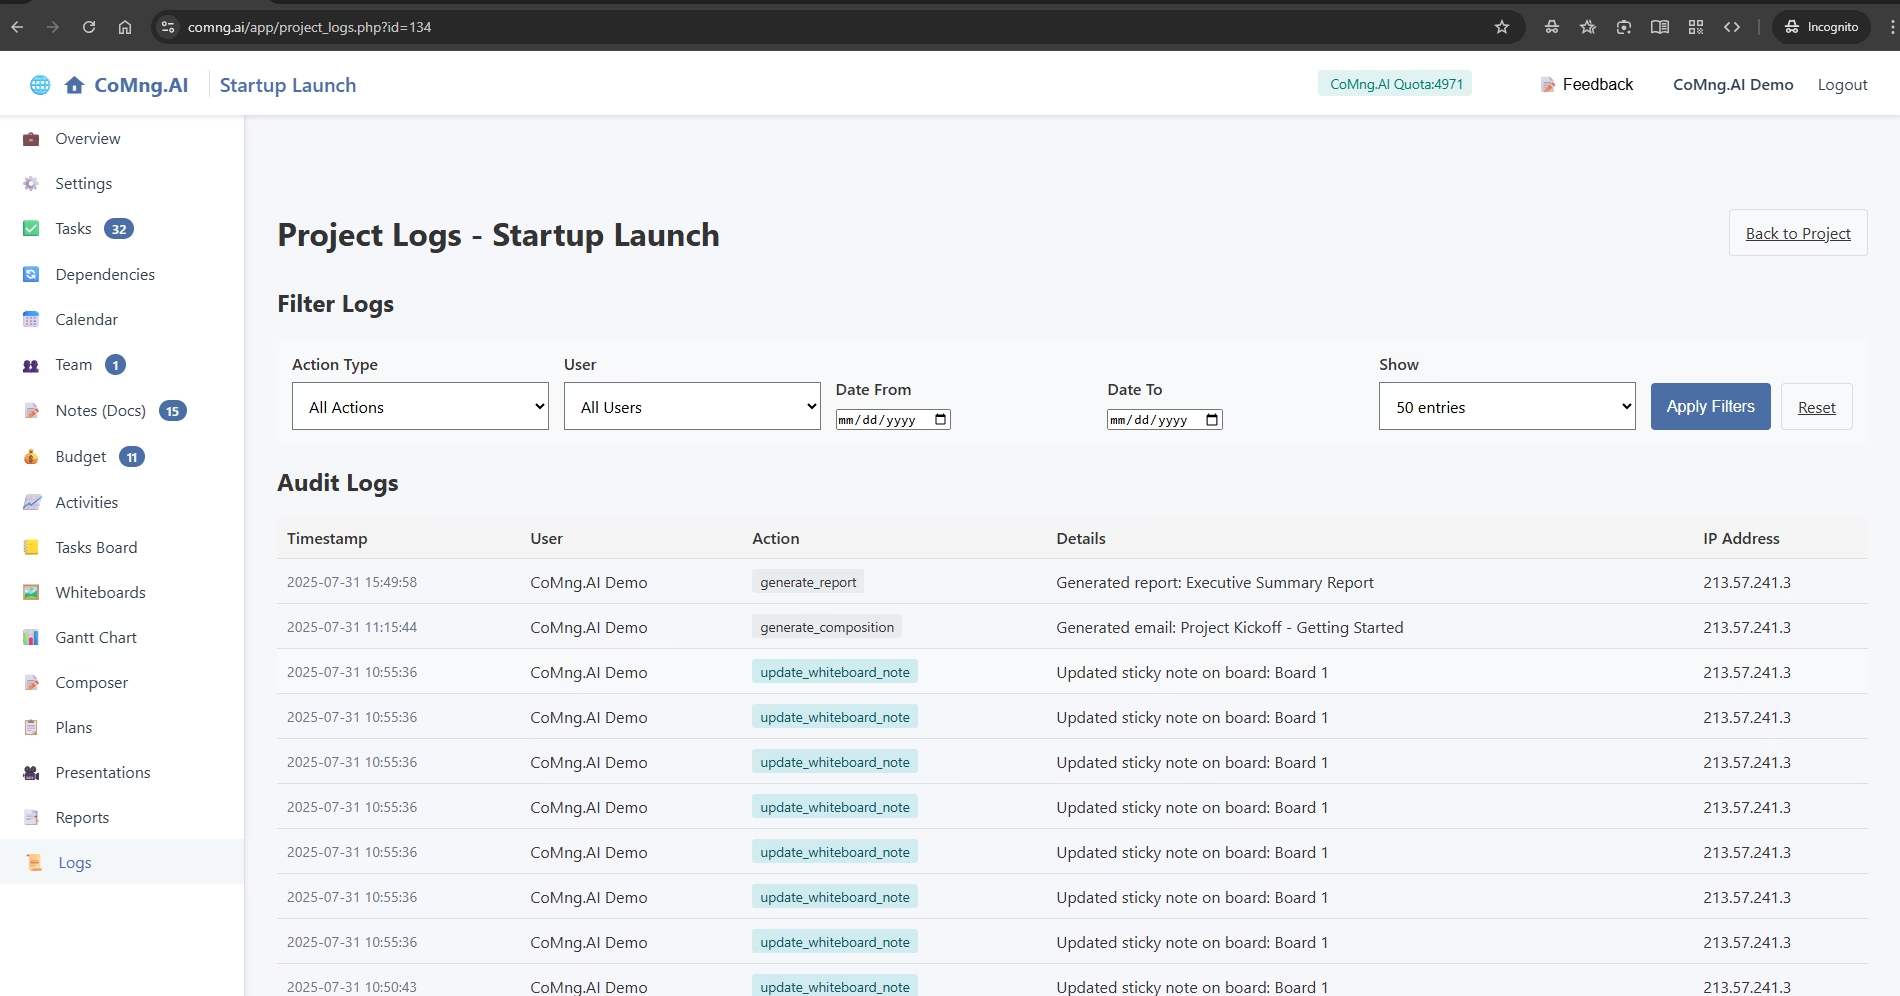
Reviewing Project History with Audit Logs
Explain how to use the Logs page to review a detailed, unchangeable history of all actions taken within a project