Tag: milestone-tracking
-
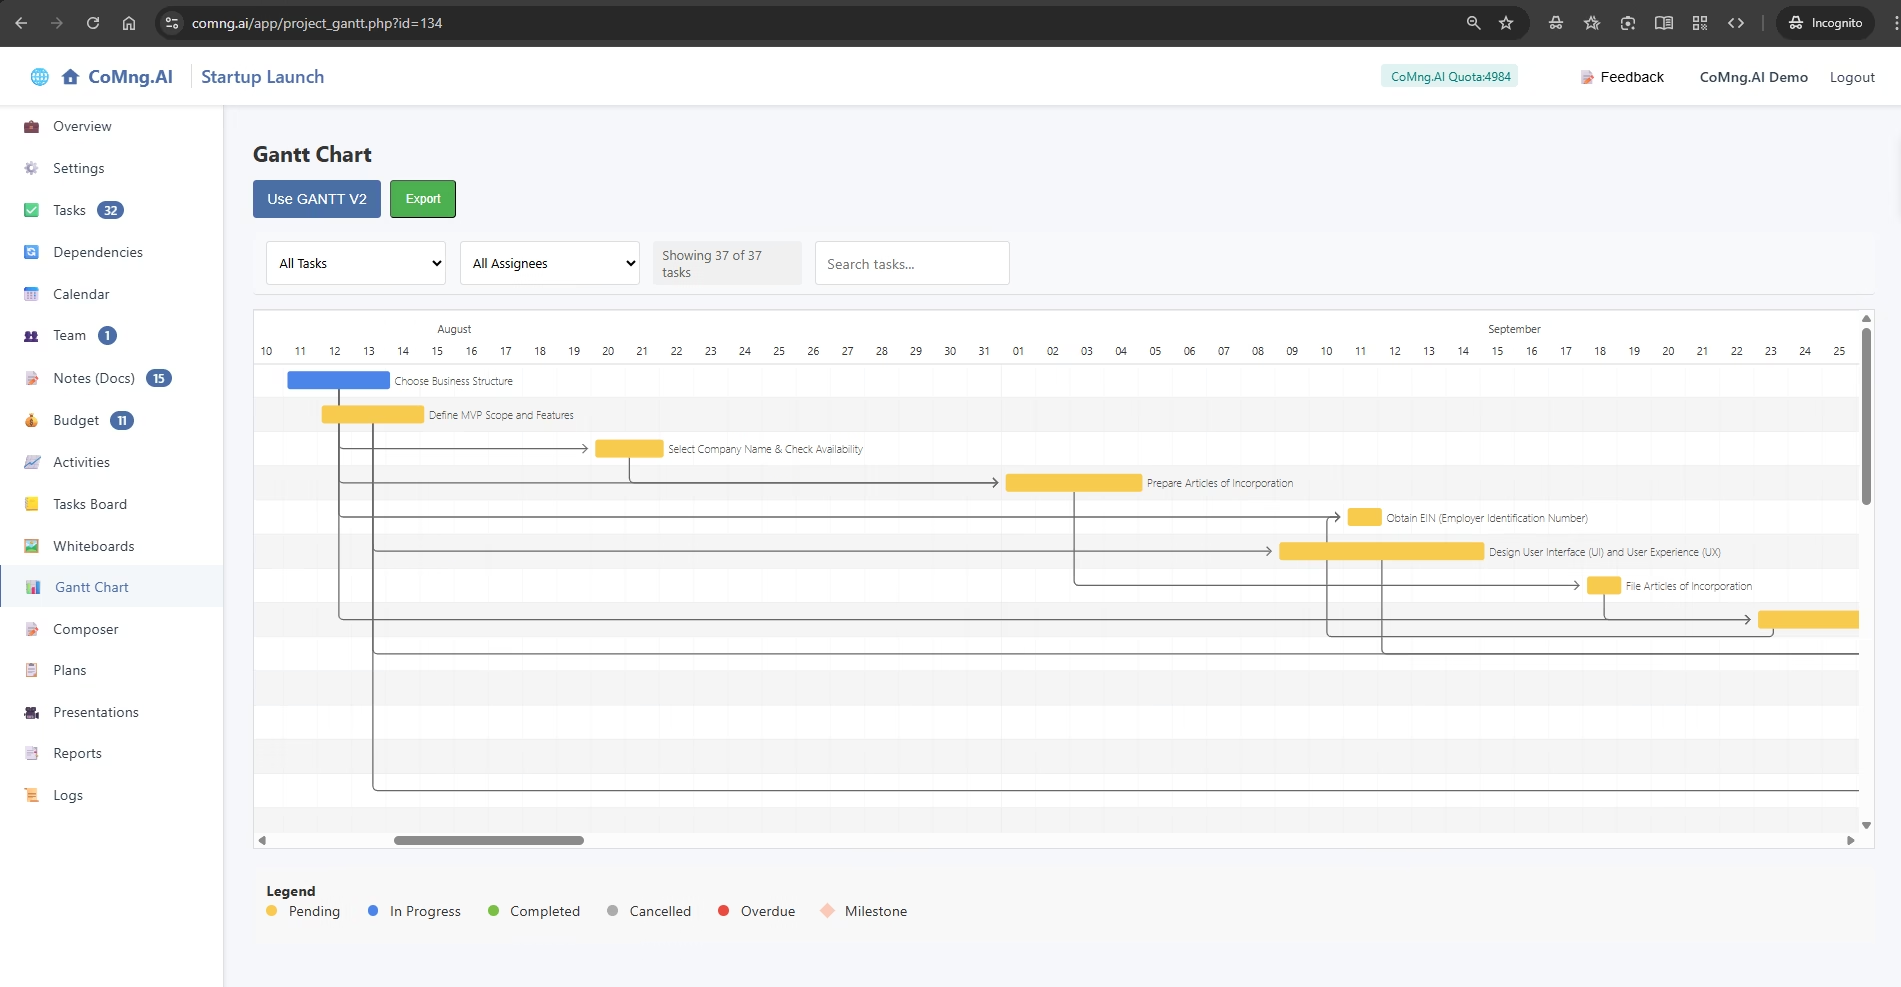
Explain how to use the Gantt Chart to see a visual representation of the project timeline, understand task relationships and durations, and track progress over time
Explain how to use the Gantt Chart to see a visual representation of the project timeline, understand task relationships and durations, and track progress over time