It’s Thursday afternoon. Your weekly stakeholder meeting is tomorrow morning at 9 AM, and you still need to compile the project status report. You know the drill: pull data from three different tools, update the Excel template, chase down two team leads for their updates, create summary charts, write narrative explanations, and somehow make sense of why Task #47 is still “in progress” after three weeks.
You’ll spend the next 2-3 hours on this. And you’ll do it again next week. And the week after.
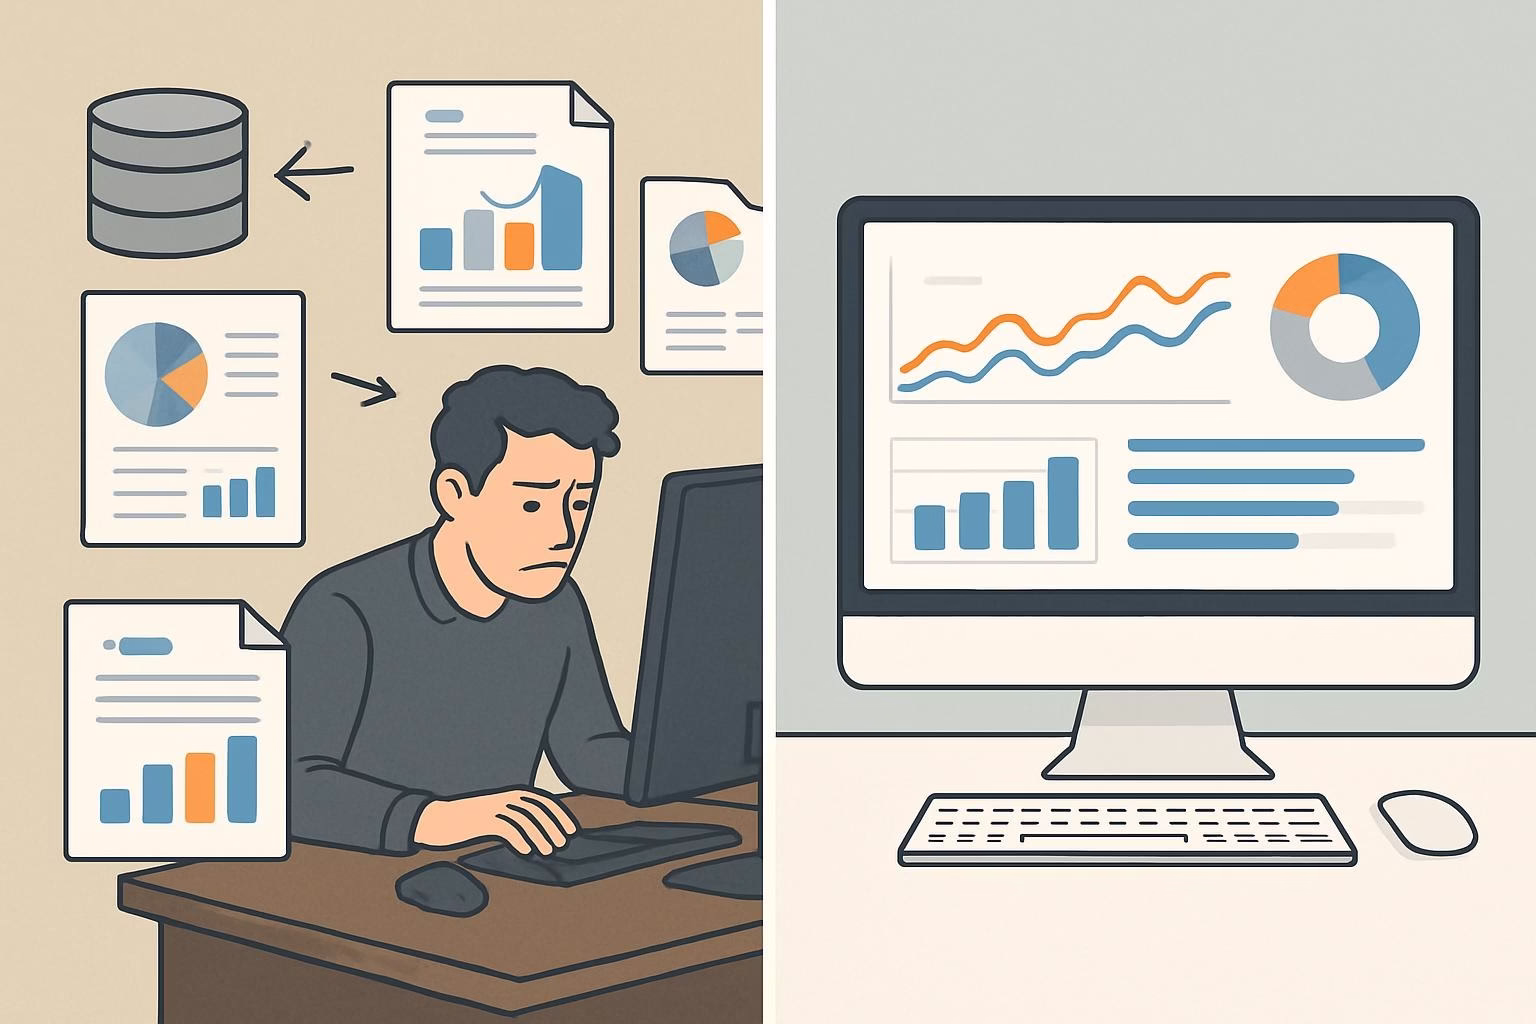
Here’s the frustrating reality: project managers spend an average of 6-8 hours per week creating reports that often sit unread in email inboxes. That’s 312-416 hours per year – nearly two full months of work – dedicated to documentation instead of actual project delivery.
In this guide, you’ll discover exactly how AI transforms project reporting from a time-consuming manual task into an automatic, always-current process. You’ll see specific examples of what gets automated, what AI can’t do, and how teams are reclaiming 70-80% of their reporting time while actually improving report quality and accuracy.
Can AI Really Generate Project Reports Automatically?
Yes, AI can generate comprehensive project reports automatically – and not just simple data dumps. Modern AI systems create narrative-driven reports that synthesize information from multiple sources, identify key trends and risks, generate visualizations, and tailor the content to different stakeholder audiences. Instead of manually compiling data and writing summaries, AI continuously monitors your project data and generates reports on-demand or on schedule.
Here’s what makes this transformative: AI doesn’t just pull numbers into a template. It analyzes project velocity, compares current progress against historical patterns, identifies anomalies that need attention, and writes clear explanations of what’s happening and why. A report that would take you 90 minutes to create manually is generated in 30 seconds – and it’s actually more comprehensive because AI can process far more data points than a human can review.
The key difference from basic automation: Traditional report automation simply inserts data into predefined fields. AI-powered reporting understands context. It knows that a 2-day delay on a critical path task matters more than a 5-day delay on a non-blocking task. It recognizes that the same completion percentage means something different in week 2 versus week 8 of a project. This contextual intelligence is what makes AI-generated reports genuinely useful, not just automatically generated.
How AI Report Generation Actually Works
What Gets Automated: The Four-Layer Approach
AI report generation works through four distinct but interconnected layers, each handling a different aspect of what makes a report valuable.
Layer 1: Data Collection and Synthesis
The first layer is where AI excels at scale. Traditional reporting requires you to log into your project management software, then your time tracking tool, then Slack or Teams to check communication patterns, then maybe GitHub or Jira for development velocity. You’re manually collecting puzzle pieces.
AI instead connects directly to all these systems through APIs and continuously monitors activity. When it’s time to generate a report, it already has a complete picture of what happened across your entire tool stack. This includes obvious data like task completion and timeline progress, but also subtle signals like communication frequency, code commit patterns, review cycles, and resource utilization.
What this looks like in practice: When a team member marks a task complete, AI doesn’t just record the completion. It notes how long the task took versus the estimate, whether it blocked other tasks, if questions were asked in Slack about it, and whether the completion moved the project closer to or further from the deadline. All this context gets incorporated into reporting.
Layer 2: Pattern Recognition and Analysis
Raw data means nothing without interpretation. This is where AI moves beyond traditional reporting automation. The system analyzes the collected data against several frameworks:
- Velocity trends: Is the team completing tasks faster or slower than earlier in the project? Are there patterns by day of week or time of month?
- Risk indicators: Are dependencies creating bottlenecks? Are critical path tasks showing warning signs?
- Resource patterns: Is anyone overloaded? Are specialists being utilized effectively?
- Historical comparison: How does current progress compare to similar projects at the same stage?
Modern AI systems like CoMng.AI use machine learning models trained on thousands of projects to identify patterns that indicate success or trouble. When your project velocity drops 15%, AI doesn’t just report the number – it identifies whether this matches a normal mid-project slowdown or signals an emerging problem.
Layer 3: Narrative Generation
This is where AI demonstrates sophistication beyond simple automation. The system takes analyzed data and writes clear, readable explanations in natural language. Instead of forcing stakeholders to interpret charts and numbers, AI creates sentences like:
- “The design phase completed two days ahead of schedule, primarily due to faster-than-expected approval cycles.”
- “Task 47 (API integration) remains in progress for its third week. Based on Slack activity and commit patterns, this appears to be blocked by unresolved questions about authentication requirements.”
- “Resource utilization is currently at 87%, with Sarah’s capacity maxed at 100% for the next two weeks while the rest of the team averages 75%.”
The AI doesn’t just state what happened – it explains why and what it means. This contextual narrative is what makes reports actionable instead of just informative.
Layer 4: Stakeholder Customization
Different audiences need different information. Your executive sponsor wants high-level progress and budget burn rate. Your client wants deliverable status and upcoming milestones. Your team wants detailed task breakdowns and blocker resolution.
AI generates multiple versions of the same report automatically, each tailored to its audience. The data source is identical, but the emphasis, detail level, and framing adjust based on who’s reading. This is something that’s theoretically possible with manual reporting but practically never happens because creating five different versions of a report would multiply your 2-hour task into a full-day nightmare.
What AI Can and Can’t Do: Setting Realistic Expectations
AI excels at:
- Synthesizing quantitative data from multiple sources
- Identifying statistical patterns and anomalies
- Generating clear written summaries of objective status
- Creating visualizations and charts automatically
- Maintaining consistency in report structure and format
- Tracking changes and trends over time
- Delivering reports on precise schedules
AI currently struggles with:
- Subjective team morale assessment (requires human interpretation)
- Political or organizational context that isn’t captured in data
- Highly nuanced stakeholder communication that requires emotional intelligence
- One-off unique situations without historical precedent
- Creative problem-solving recommendations that require deep domain expertise
The optimal approach: AI handles the 80% that’s data-driven and repeatable, while you focus on the 20% that requires human judgment, relationship management, and strategic thinking. Instead of spending all your time creating the report, you spend 10-15 minutes reviewing AI’s draft and adding the human context that makes it complete.
Real-World Report Automation in Action
Example 1: Weekly Status Reports for a Software Development Team
The traditional approach (90 minutes):
- 20 minutes: Log into Jira, export data, create Excel pivot tables
- 15 minutes: Check GitHub for commit activity and pull request status
- 20 minutes: Review Slack to understand blockers and team discussions
- 25 minutes: Write narrative summaries explaining what the data means
- 10 minutes: Create charts and format the document
The AI approach with CoMng.AI (5 minutes):
- AI automatically generates the report from the live project data
- You spend 5 minutes reviewing for anything AI might have missed (usually nothing)
- You add a brief subjective note if needed (“Team morale is great despite the tight timeline”)
- You can distribute the report to stakeholders via email and Slack
The actual generated report includes:
- Sprint velocity with week-over-week comparison
- Completed features with links to pull requests
- Active tasks with progress percentages and blockers
- Risk flags for tasks approaching deadlines
- Team capacity utilization
- Automated recommendations (“Consider moving task #23 to next sprint based on current velocity”)
Time saved: 85 minutes per week = 74 hours per year per project
Example 2: Monthly Executive Summary for a Marketing Campaign
What AI generates automatically:
- Campaign performance metrics with month-over-month trends
- Budget burn rate with forecast to completion
- Deliverable status categorized by on-track, at-risk, and delayed
- Key achievements written as bullet points
- Risk summary with probability assessments
- Three-month lookahead showing upcoming milestones
The human addition:
- A brief paragraph on strategic adjustments based on market feedback
- Context on external factors (competitor activity, market conditions)
- Recommendations that require judgment calls
Result: A comprehensive executive report that would take 2 hours to create manually is ready in 2 minutes, with 10 minutes of human refinement for the strategic context.
Example 3: Client-Facing Project Dashboard
AI maintains in real-time:
- Live project timeline with actual vs. planned progress
- Deliverable tracking with completion percentages
- Upcoming milestone dates with confidence levels
- Recent accomplishments (automatically populated from completed tasks)
- Action items requiring client input
- Budget status if applicable
Client impact: Instead of waiting for your weekly update email, clients can check the dashboard anytime and see current status. This dramatically reduces “where are we at?” emails and builds trust through transparency.
Your impact: You’re no longer creating the same update multiple times in different formats. AI maintains one source of truth that auto-updates as project status changes.
Putting AI Report Generation Into Practice
Modern AI project management platforms like CoMng.AI approach automated reporting through a workflow that balances automation with human oversight. Here’s how it works in practice:
The Initial Setup (One-Time Configuration)
Step 1: Create and Update Your Project Foundation with CoMng.AI’s AI Capabilities (15-20 minutes) Use CoMng.AI to build and continuously refine your project foundation. Leverage its AI capabilities to organize tasks, set priorities, and keep your project information up to date, ensuring your team stays aligned and productive throughout the project lifecycle.
Step 2: Define Report Templates (30-45 minutes) You create report templates for your different stakeholder groups. For each template, you specify:
- Which data points to include (velocity, budget, risks, etc.)
- Level of detail (executive summary vs. detailed breakdown)
- Tone and framing (optimistic, neutral, or cautious)
- Distribution schedule (daily, weekly, monthly, or on-demand)
The system comes with intelligent defaults based on best practices, so you’re usually modifying rather than building from scratch.
Step 3: Set Smart Defaults (10 minutes) AI learns from your preferences. If you consistently edit certain auto-generated sections, it adapts. If you always add context about specific types of tasks, it starts flagging those for your review. The system becomes more aligned with your reporting style over time.
The Ongoing Workflow (Minimal Ongoing Effort)
Daily: AI monitors all connected systems and updates its understanding of project status. You do nothing.
Weekly/Monthly: AI automatically generates reports according to your schedule. You receive a notification that your draft is ready.
Your Review (5-10 minutes): You check the AI-generated draft. In most cases, it’s accurate and complete. You add any subjective context or strategic commentary that requires human judgment. You approve and distribute.
Edge Cases: If AI encounters something unusual it can’t interpret (a completely new type of task, a tool malfunction creating weird data), it flags this for your review rather than making assumptions.
The Value Proposition: You go from spending 6-8 hours per week on reporting to spending 20-30 minutes. That’s an 85-90% time reduction while actually improving report consistency and completeness.
Real Team Example: From 8 Hours to 45 Minutes
A product development team managing three concurrent projects was spending approximately 8 hours per week on reporting:
- 3 hours on internal team status updates
- 3 hours on client-facing progress reports
- 2 hours on executive summaries for leadership
After implementing CoMng.AI’s automated reporting:
- Internal status: Fully automated, generated every Monday morning, reviewed in 10 minutes
- Client reports: Automated with custom dashboards, 15 minutes to add strategic context
- Executive summaries: AI-generated monthly with 20 minutes of human refinement
Total time: 45 minutes per week instead of 8 hours Time reclaimed: 7.25 hours per week = 377 hours per year Value of reclaimed time: At $75/hour for a mid-level PM, that’s $28,275 in productivity gained annually
Quality improvement: Reports are more consistent, never miss data points, and are actually more comprehensive because AI can process information from more sources than a human can manually review.
Common Mistakes to Avoid
Mistake #1: Trusting AI Blindly Without Review
The problem: AI is extremely good but not perfect. Sometimes it misinterprets context or doesn’t have information about external factors.
The solution: Treat AI as a highly capable draft creator, not a final publisher. Spend 5-10 minutes reviewing each generated report before distribution. This quick review catches the occasional error while still saving massive time.
Real example: AI flagged a task as “at risk” because it showed no activity for 5 days. The reality was the team member was on approved vacation. A human reviewer catches this in 10 seconds and updates the report.
Mistake #2: Over-Customizing Report Templates
The problem: Teams sometimes create 10+ different report templates for minor variations in stakeholder preferences. This defeats the purpose of automation.
The solution: Create 3-4 core templates maximum (internal team, client-facing, executive summary, detailed technical). Use AI’s audience customization features to handle variations within these templates.
The efficiency impact: Each additional template you maintain is another thing to review and update. Keep it simple.
Mistake #3: Not Training AI on Your Specific Context
The problem: AI works well with general defaults, but it gets significantly better when it understands your team’s specific terminology, priorities, and patterns.
The solution: During the first 2-3 weeks, actively review AI-generated reports and provide feedback. When AI uses the wrong term, correct it. When it doesn’t emphasize something important to you, flag it. Modern systems learn quickly.
The payoff: After a few weeks of feedback, AI-generated reports will be 95% ready to send with minimal human editing.
Mistake #4: Forgetting to Update Stakeholder Expectations
The problem: If you’ve been sending weekly reports every Friday at 5 PM with extensive commentary, and you suddenly switch to AI-generated reports that arrive Monday morning with less narrative, stakeholders might be confused or concerned.
The solution: Communicate the change. Explain that reports will be more frequent and data-driven, with human commentary added where it’s most valuable. Most stakeholders appreciate more frequent, automated updates over less frequent manual ones.
Mistake #5: Using AI Reports as a Substitute for Communication
The problem: Automated reports are incredibly useful, but they don’t replace human conversation about project challenges, strategic decisions, or team dynamics.
The solution: Use the time you save on report creation to have more meaningful conversations with stakeholders about what matters. The report provides the data foundation; you provide the relationship and strategic thinking.
The winning approach: “Here’s this week’s automated status report with all the numbers. I’d love to spend our call discussing the resource allocation challenge I mentioned rather than walking through charts you can already see.”
The Closing: Making the Shift to Automated Reporting
The core insight: AI-generated project reports aren’t about eliminating your role – they’re about elevating it. When you’re not spending hours compiling data and writing summaries of obvious information, you can focus on the strategic analysis, relationship building, and problem-solving that actually drive project success.
The technology is mature and proven. Teams across industries – from software development to construction to marketing – are already operating with automated reporting as their standard practice. The question isn’t whether this works (it does), but whether you’re ready to reclaim 70-80% of the time you currently spend on reporting.
Looking ahead: As AI continues improving, we’ll see even more sophisticated capabilities. Imagine reports that don’t just describe what happened but automatically generate multiple scenarios for how to respond to emerging risks. Or reports that proactively suggest resource reallocation before you even ask. The trajectory is clear: reporting becomes less about documentation and more about decision support.
Your next step: If you’re spending more than 2 hours per week on project reporting, you’re working harder than necessary. Modern AI can handle the data synthesis, pattern recognition, and initial draft creation automatically.
Try it yourself: See how AI handles your actual project data – not a demo environment or sanitized sample. Connect CoMng.AI to your existing tools and generate your first automated report. You’ll see a complete draft within minutes, based on real data from your current projects. Try it free with no credit card required.
FAQ: AI-Generated Project Reports
Q: Will stakeholders trust AI-generated reports? A: Yes, if you introduce the change properly. Stakeholders care about accuracy, timeliness, and relevance – not who wrote the report. In practice, AI-generated reports are often more trusted because they’re more consistent and comprehensive than manual reports. The key is to maintain human oversight and add strategic context where needed.
Q: What happens if AI gets something wrong? A: You catch it during your 5-10 minute review before distribution. AI mistakes are rare but do happen. The review process is your quality gate. Think of AI as an extremely capable assistant who drafts the report for you to approve.
Q: What if my project requires highly customized reporting formats? A: AI works with custom templates. You define the structure, sections, and metrics you want. AI handles populating those templates with current data and generating the narrative content. Even highly specialized reports can be automated.
Q: Does automated reporting work for agile/scrum teams? A: Absolutely. AI-generated reports are particularly valuable for agile teams because the rapid iteration means status changes frequently. Automated sprint reports, burndown analysis, and velocity tracking are some of the most popular use cases.
Q: How much does AI report generation typically cost? A: Cost varies by platform and team size. Most solutions are priced per user per month (typically $15-40/user). Calculate your ROI by considering the time saved: if you’re saving 6 hours/week at $75/hour, that’s $450/week in reclaimed productivity. Most teams see 5-10x ROI within the first month.
Leave a Reply