How to Use the Presentation Generator
Audience: All project members, especially those who need to report on project status and performance to stakeholders.
Goal: To explain how to use the Presentation Generator to rapidly create detailed outlines and supporting visuals for a wide variety of project-related presentations.
The Presentations generator is your personal speechwriter and graphic designer rolled into one. It saves you hours of preparation by automatically creating a detailed outline for your presentation, pulling live data from your project to form key talking points, identifying necessary data, and even generating the charts and visuals for your slides.
Step 1: Define Your Presentation
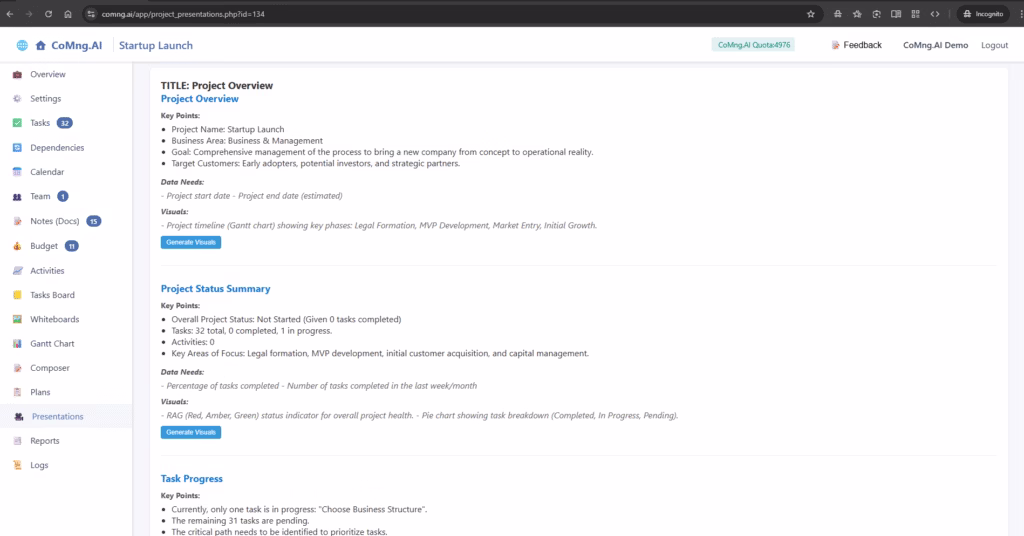
The process starts on the main Presentations page.
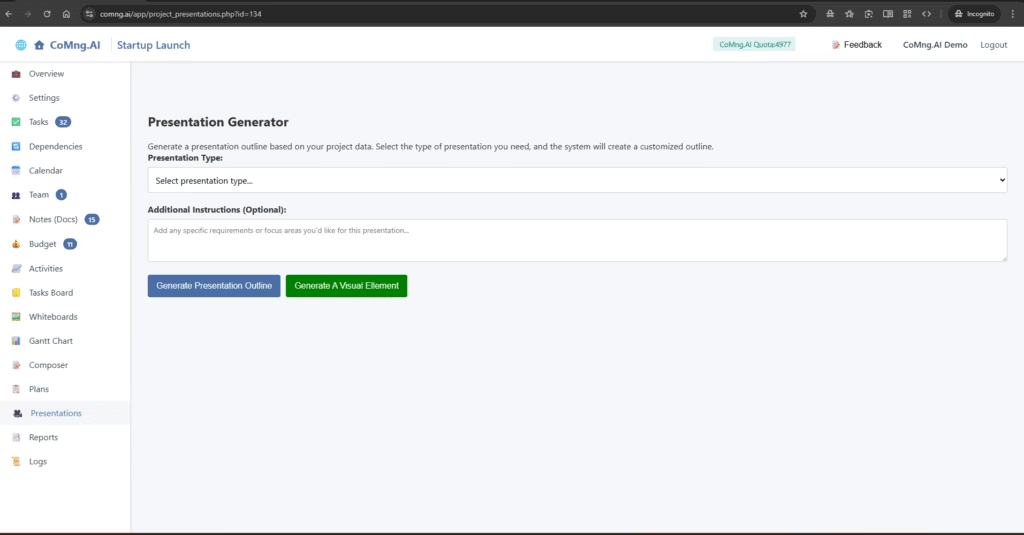
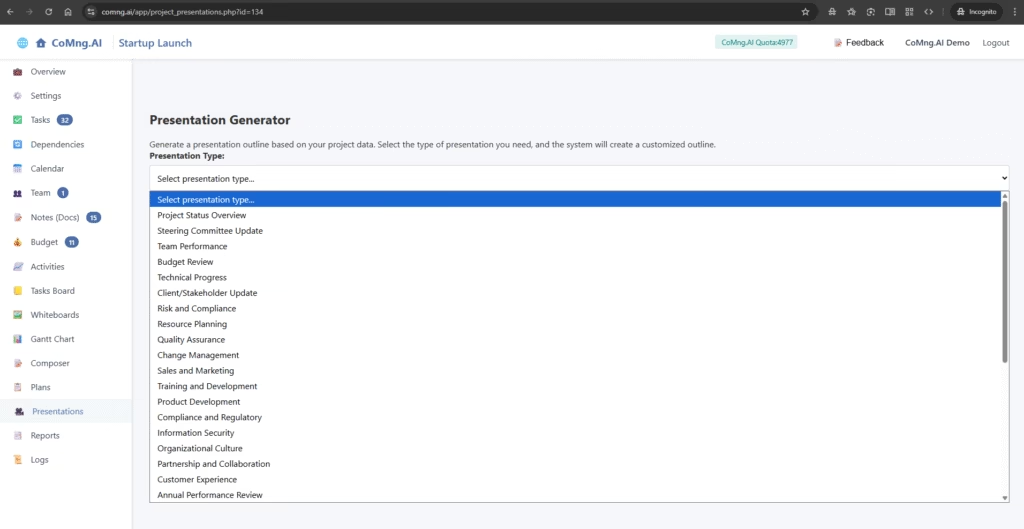
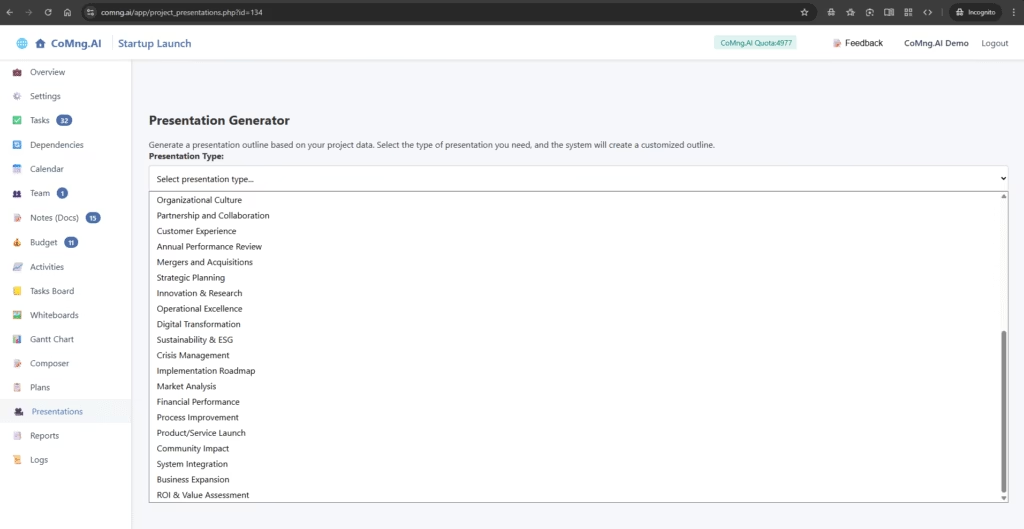
- Select Presentation Type: This is the most important step. Click the dropdown menu to choose the kind of presentation you need to give. The list is extensive, including everything from a Project Status Overview to a Steering Committee Update or a Budget Review.
- Add Additional Instructions (Optional): Use this text box to give the AI any specific focus areas or requirements. For example, “Please focus on the marketing-related tasks” or “Emphasize the budget risks.”
- Click the Generate Presentation Outline button.
Step 2: Review Your Generated Outline
In seconds, the AI will produce a complete, slide-by-slide outline for your presentation.
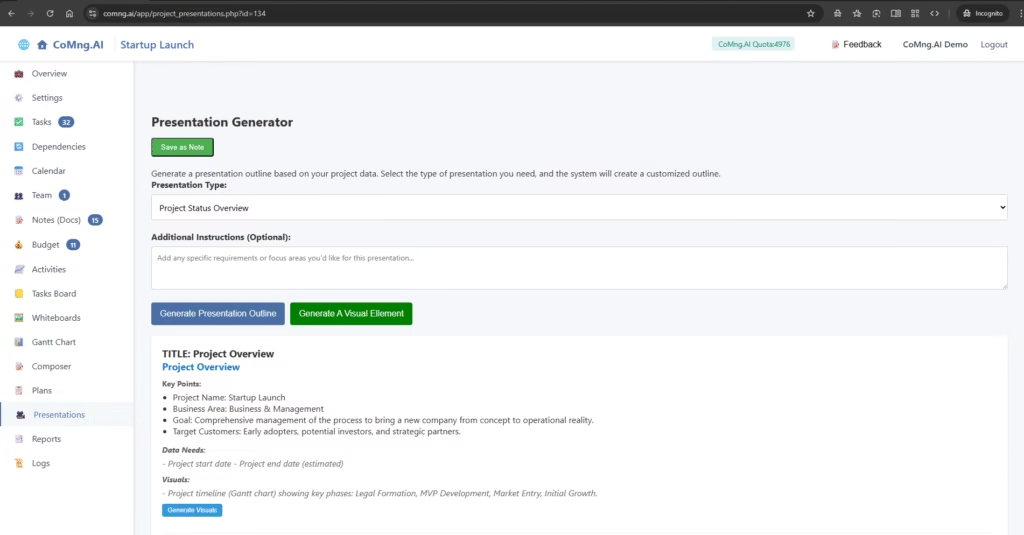
Each slide in the outline contains four key elements:
- TITLE: The title for your slide (e.g., “Project Status Summary”).
- Key Points: The main talking points for that slide, populated with real data from your project.
- Data Needs: A list of the specific data points you should present on the slide to support your key points.
- Visuals: A description of the recommended visual aid (like a chart or graph) for this slide.
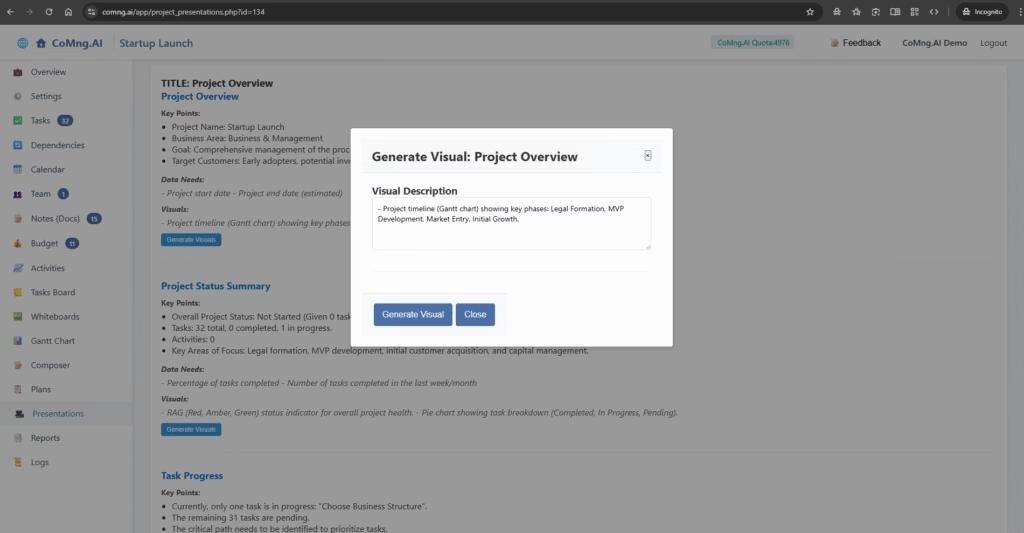
Step 3: Generate Visuals for Your Slides
CoMng.AI can create the visuals for you directly from the outline.
For any slide that suggests a visual, click the blue Generate Visual button.
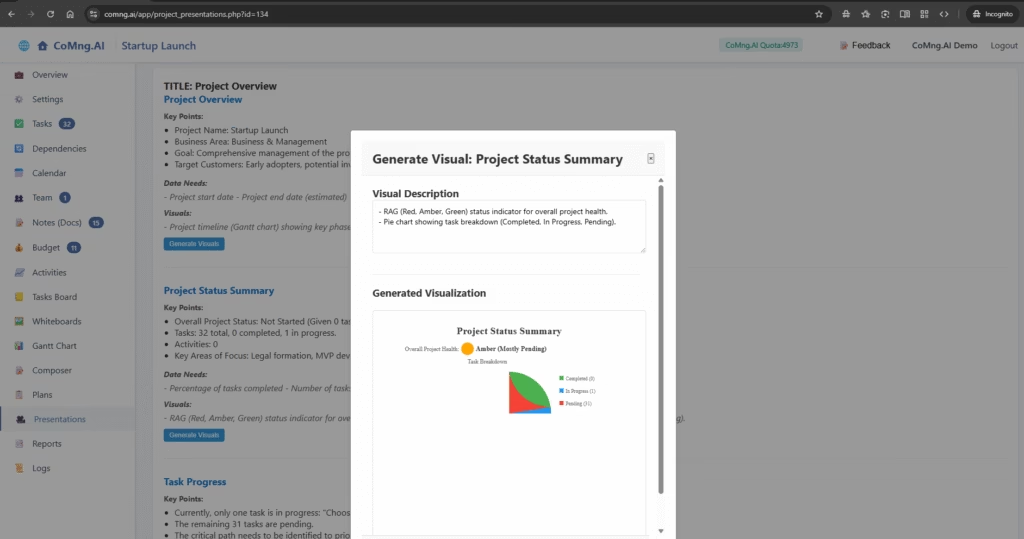
A pop-up window will appear, showing the Visual Description that the AI will use to create the chart or graph.
Click Generate Visual inside the pop-up. The AI will create the chart and display it.
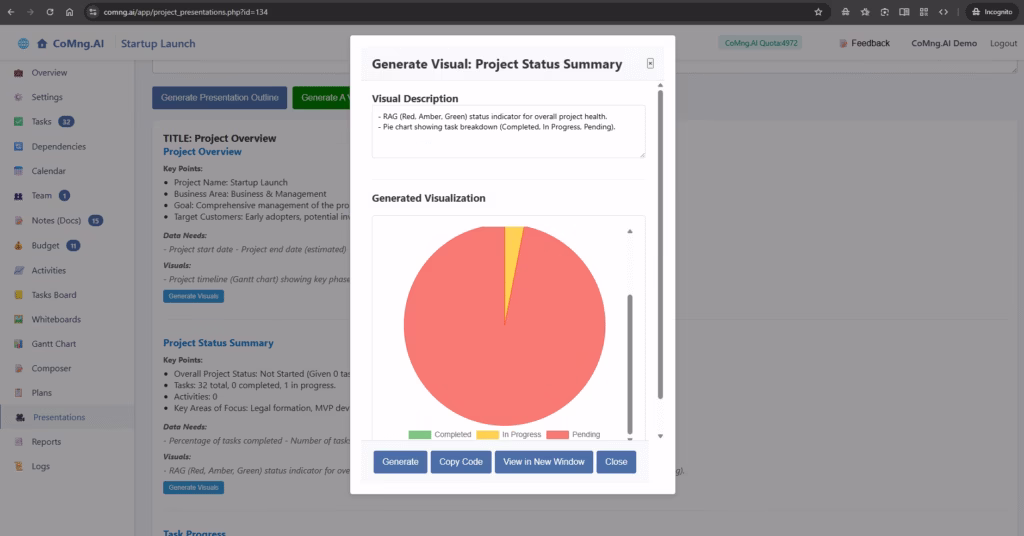
You can then use the buttons to Copy Code (for embedding in web-based tools) or View in New Window (to save the image).
Step 4: Use Your Completed Outline
Once your outline is complete, you have several options at the bottom of the page.
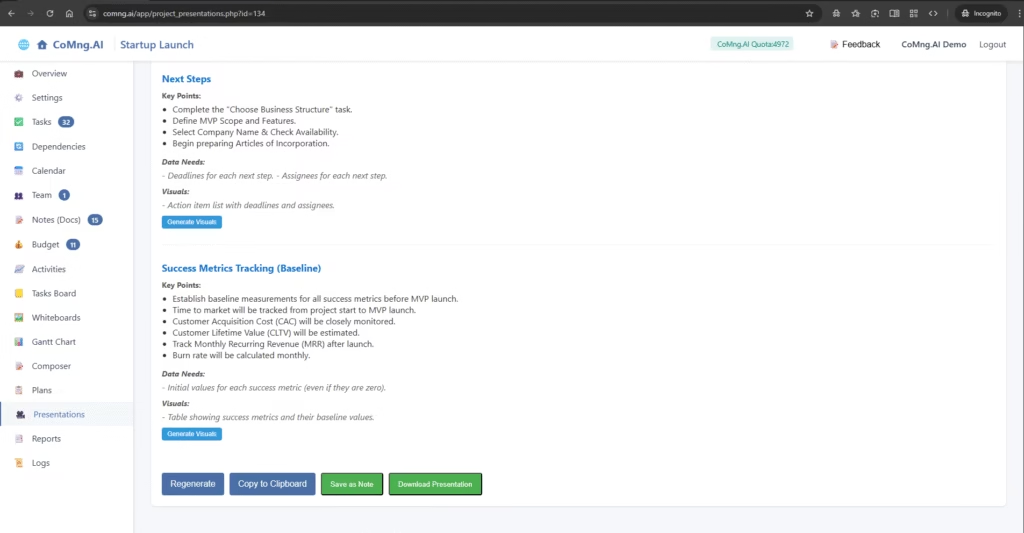
- Regenerate: Starts the process over if you want a different result.
- Copy to Clipboard: Copies the entire text outline for you to paste into PowerPoint, Google Slides, or another presentation tool.
- Save as Note: Creates a permanent record of this presentation outline in your project’s Notes (Docs) section.
 Getting Started: Creating Your First Project
") Creating a New Project (Direct Method)
Creating a New Project (Direct Method) Understanding Your Project Overview Dashboard
 Managing Your Project’s Foundation: The Settings Page
 Mastering Task Management